Windmill tracing & logging with OpenTelemetry
OpenTelemetry (OTEL) is an open-source observability framework that provides a set of APIs, libraries, agents, and instrumentation to capture and export telemetry data such as traces, metrics, and logs. It is designed to help developers and operators gain insights into the performance and behavior of their applications and infrastructure.
Core Components and Vocabulary
- Traces: Represent the execution path of a request as it traverses through various services. A trace is composed of multiple spans.
- Spans: The building blocks of a trace, representing a single operation within a trace. Each span contains metadata such as operation name, start and end timestamps, and attributes.
- Metrics: Quantitative data that measures the performance of a system, such as CPU usage, memory consumption, or request count.
- Logs: Records of events that occur within a system, providing context and details about operations and errors.
- Instrumentation: The process of adding code to applications to collect telemetry data. OpenTelemetry provides SDKs and APIs for this purpose.
- Collector: A component that receives, processes, and exports telemetry data to various backends. It acts as a central hub for telemetry data.
While Windmill offers internal service logs and alerts accessible via the Windmill UI, integrating OpenTelemetry can be beneficial for users who wish to centrally aggregate and manage traces and logs. This centralized approach allows for enhanced alerting, monitoring, and analysis capabilities, enabling users to proactively address issues and optimize their systems.
Tracing with Jaeger
Jaeger Jaeger is an open-source distributed tracing system for monitoring and debugging microservices. Originally developed by Uber, it helps track requests across services, analyze latency, identify bottlenecks, and diagnose failures.
Key use cases include debugging production issues, monitoring performance, visualizing service dependencies, and optimizing system reliability. As Jaeger supports the OpenTelemetry protocol, it can be used to collect traces from Windmill.
Setting up Jaeger
If you do not have an existing Jaeger instance, you can start a container running Jaeger with by adding the following to your docker-compose.yml file or use this docker-compose.yml file as a starting point.
  jaeger:
    image: jaegertracing/jaeger:latest
    ports:
      - "16686:16686"
    expose:
      - 4317
this will expose Jaegers UI on port 16686 and the OpenTelemetry collector on port 4317.
Configuring Windmill to use Jaeger
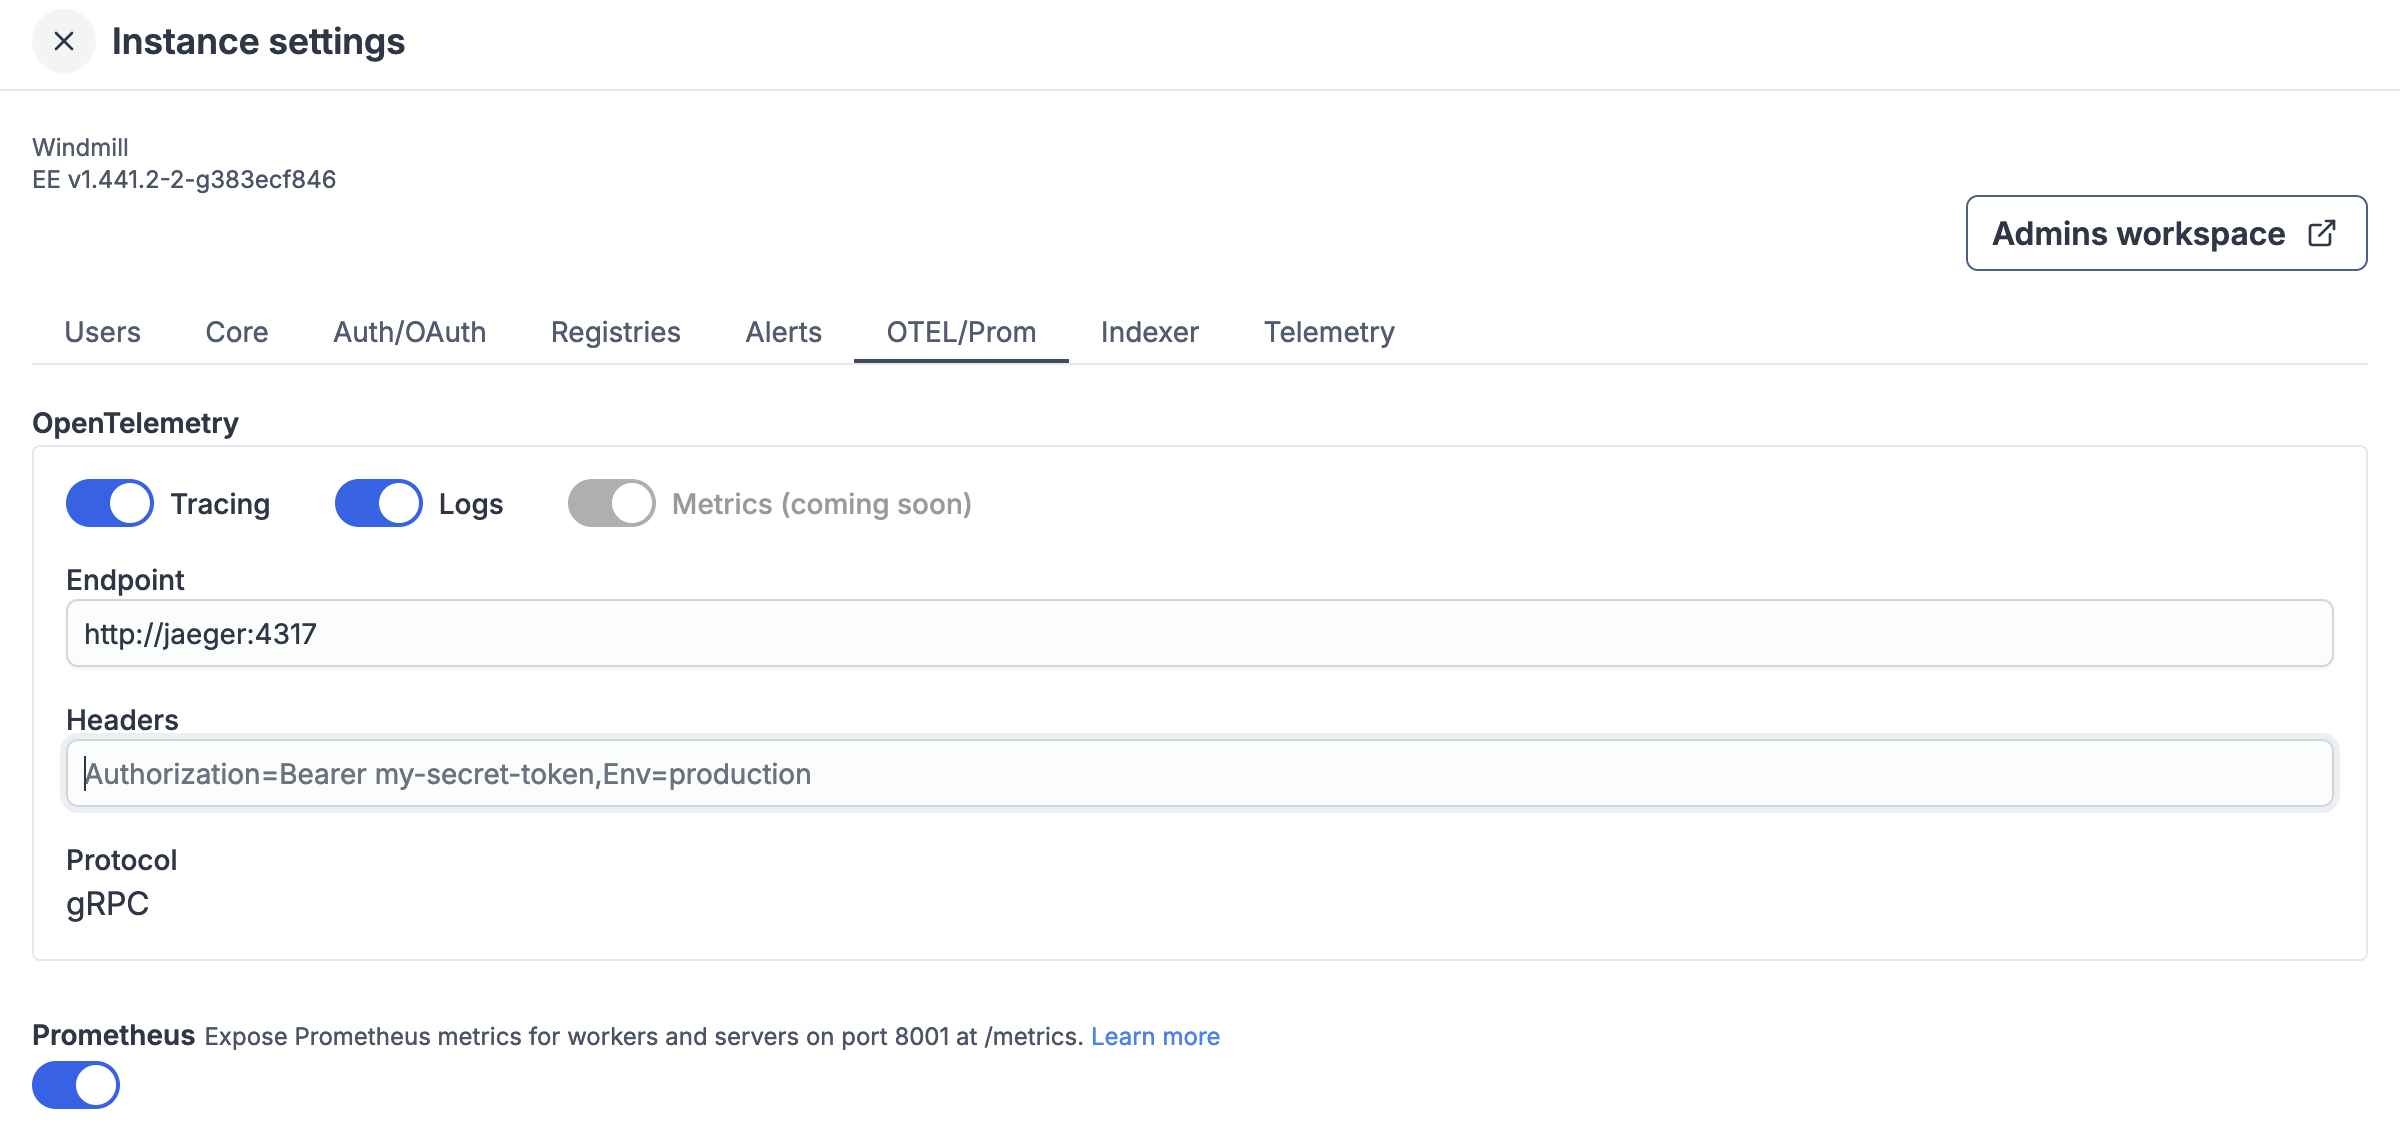
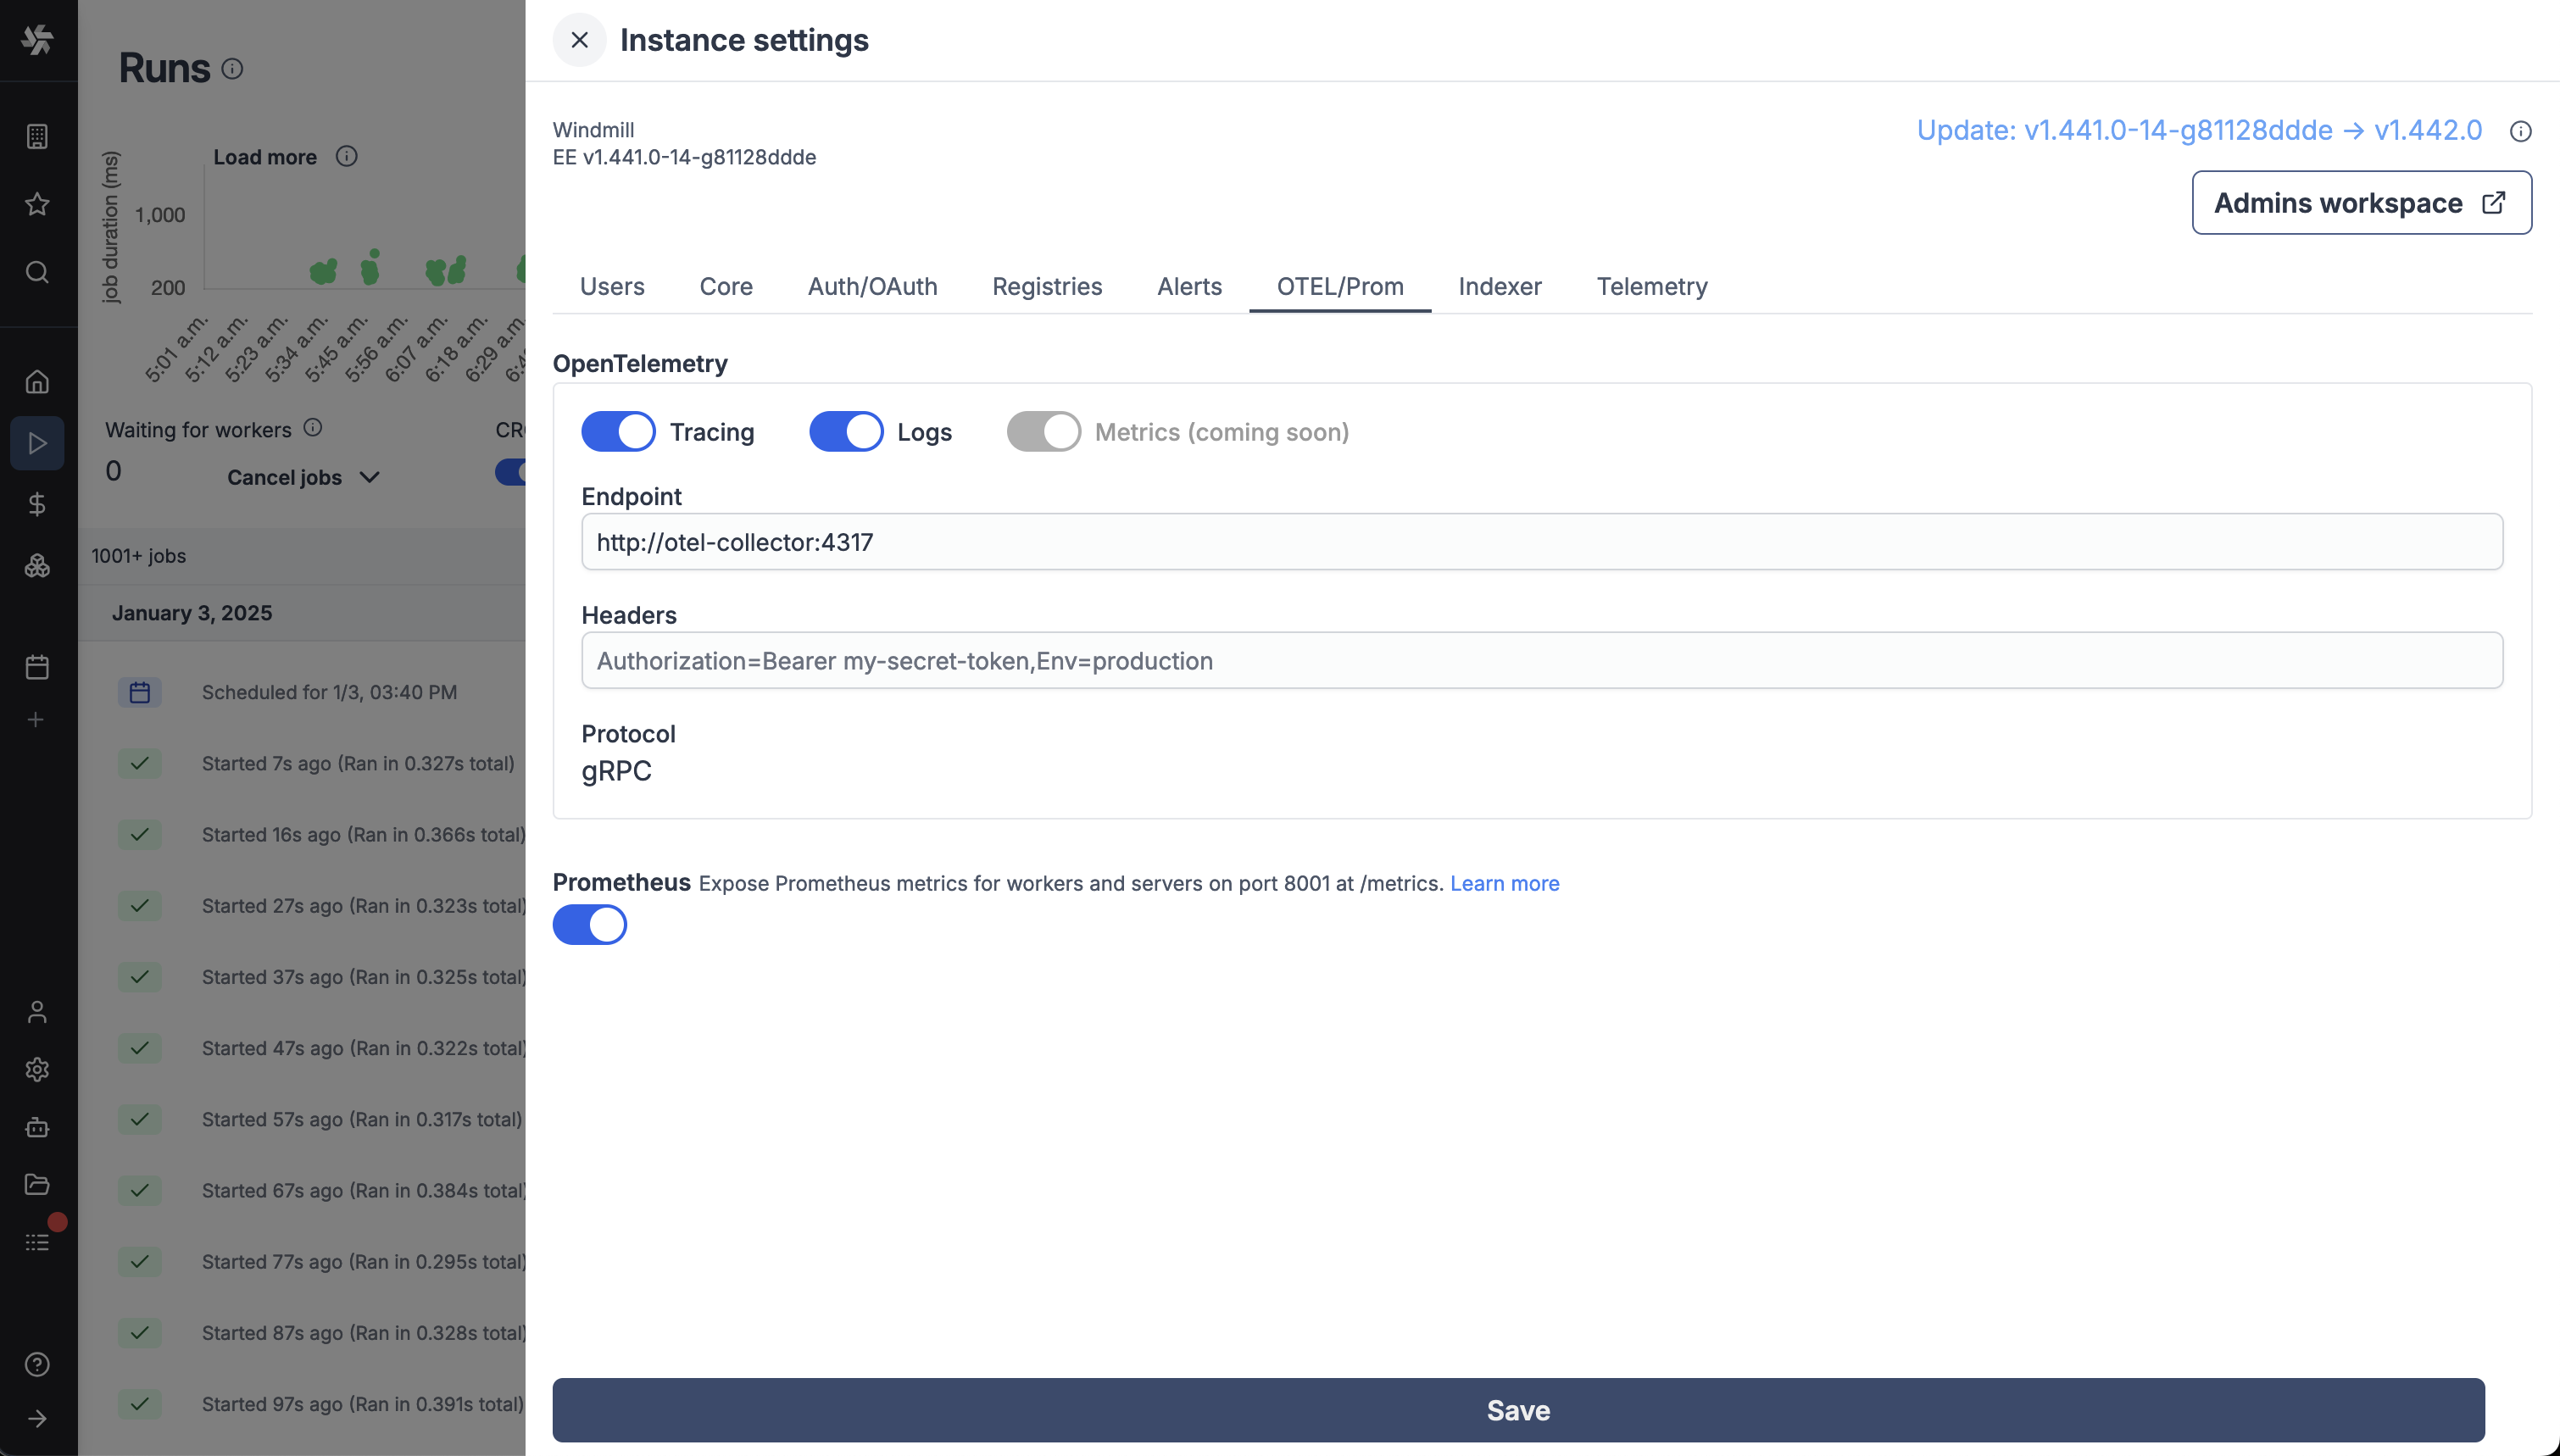
In the Windmill UI, go to the "Instances Settings" and "OTEL/Prom" tab and fill in the Jaeger endpoint and service name and toggle the Tracing option to send traces to Jaeger.
If you are using the Jaeger container, the endpoint will be http://jaeger:4317.
Open the Jaeger UI
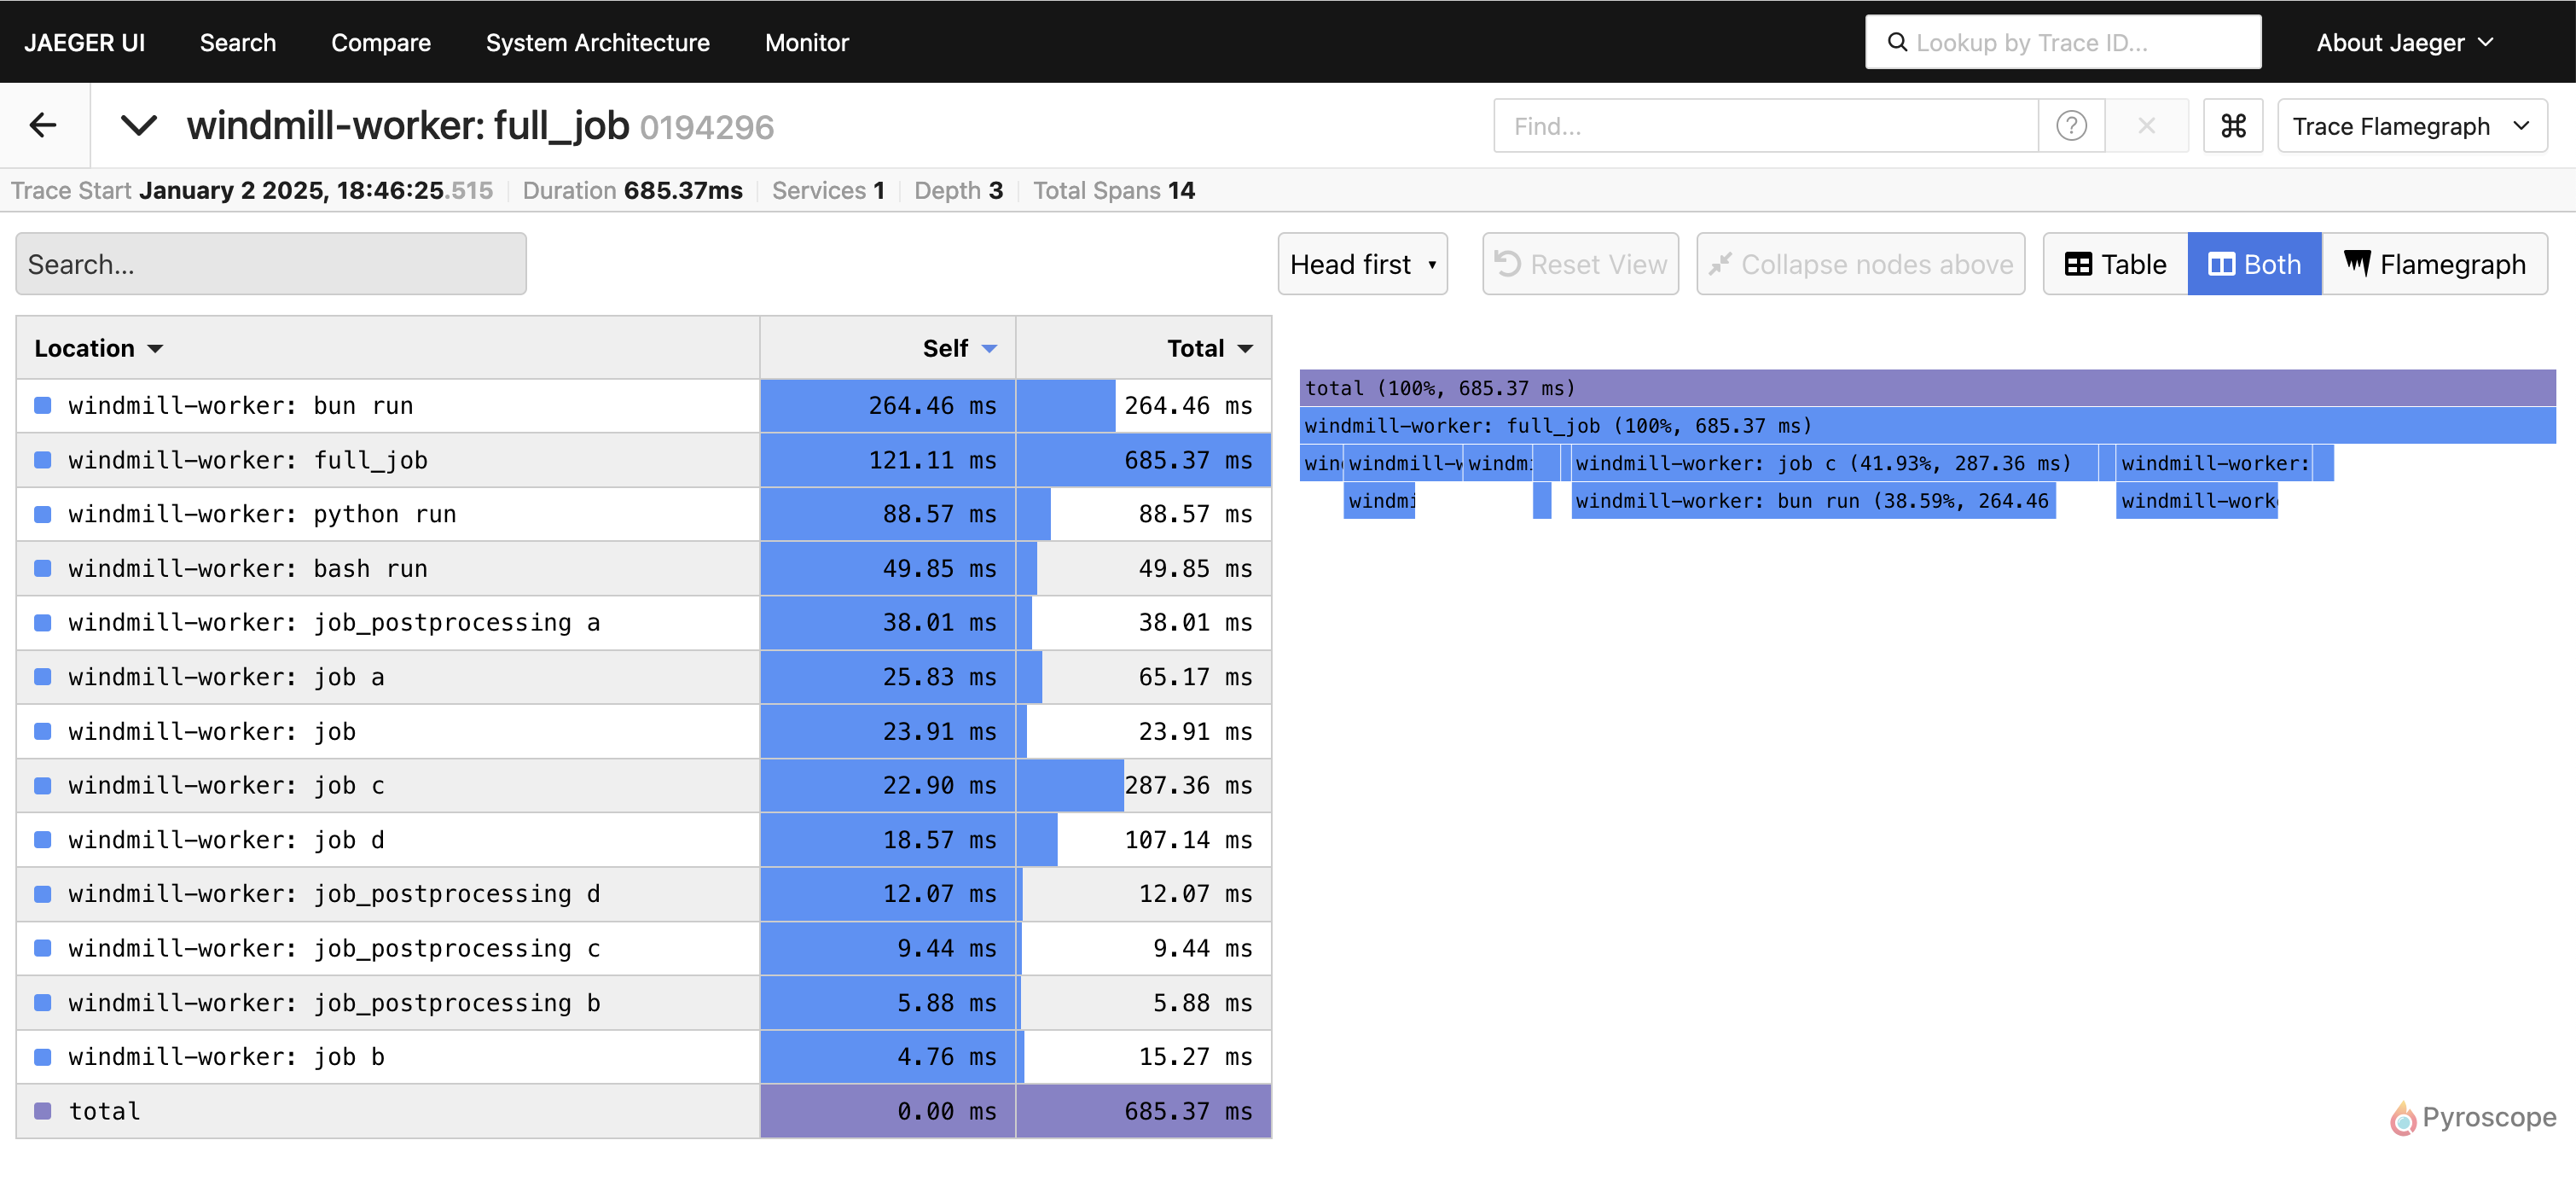
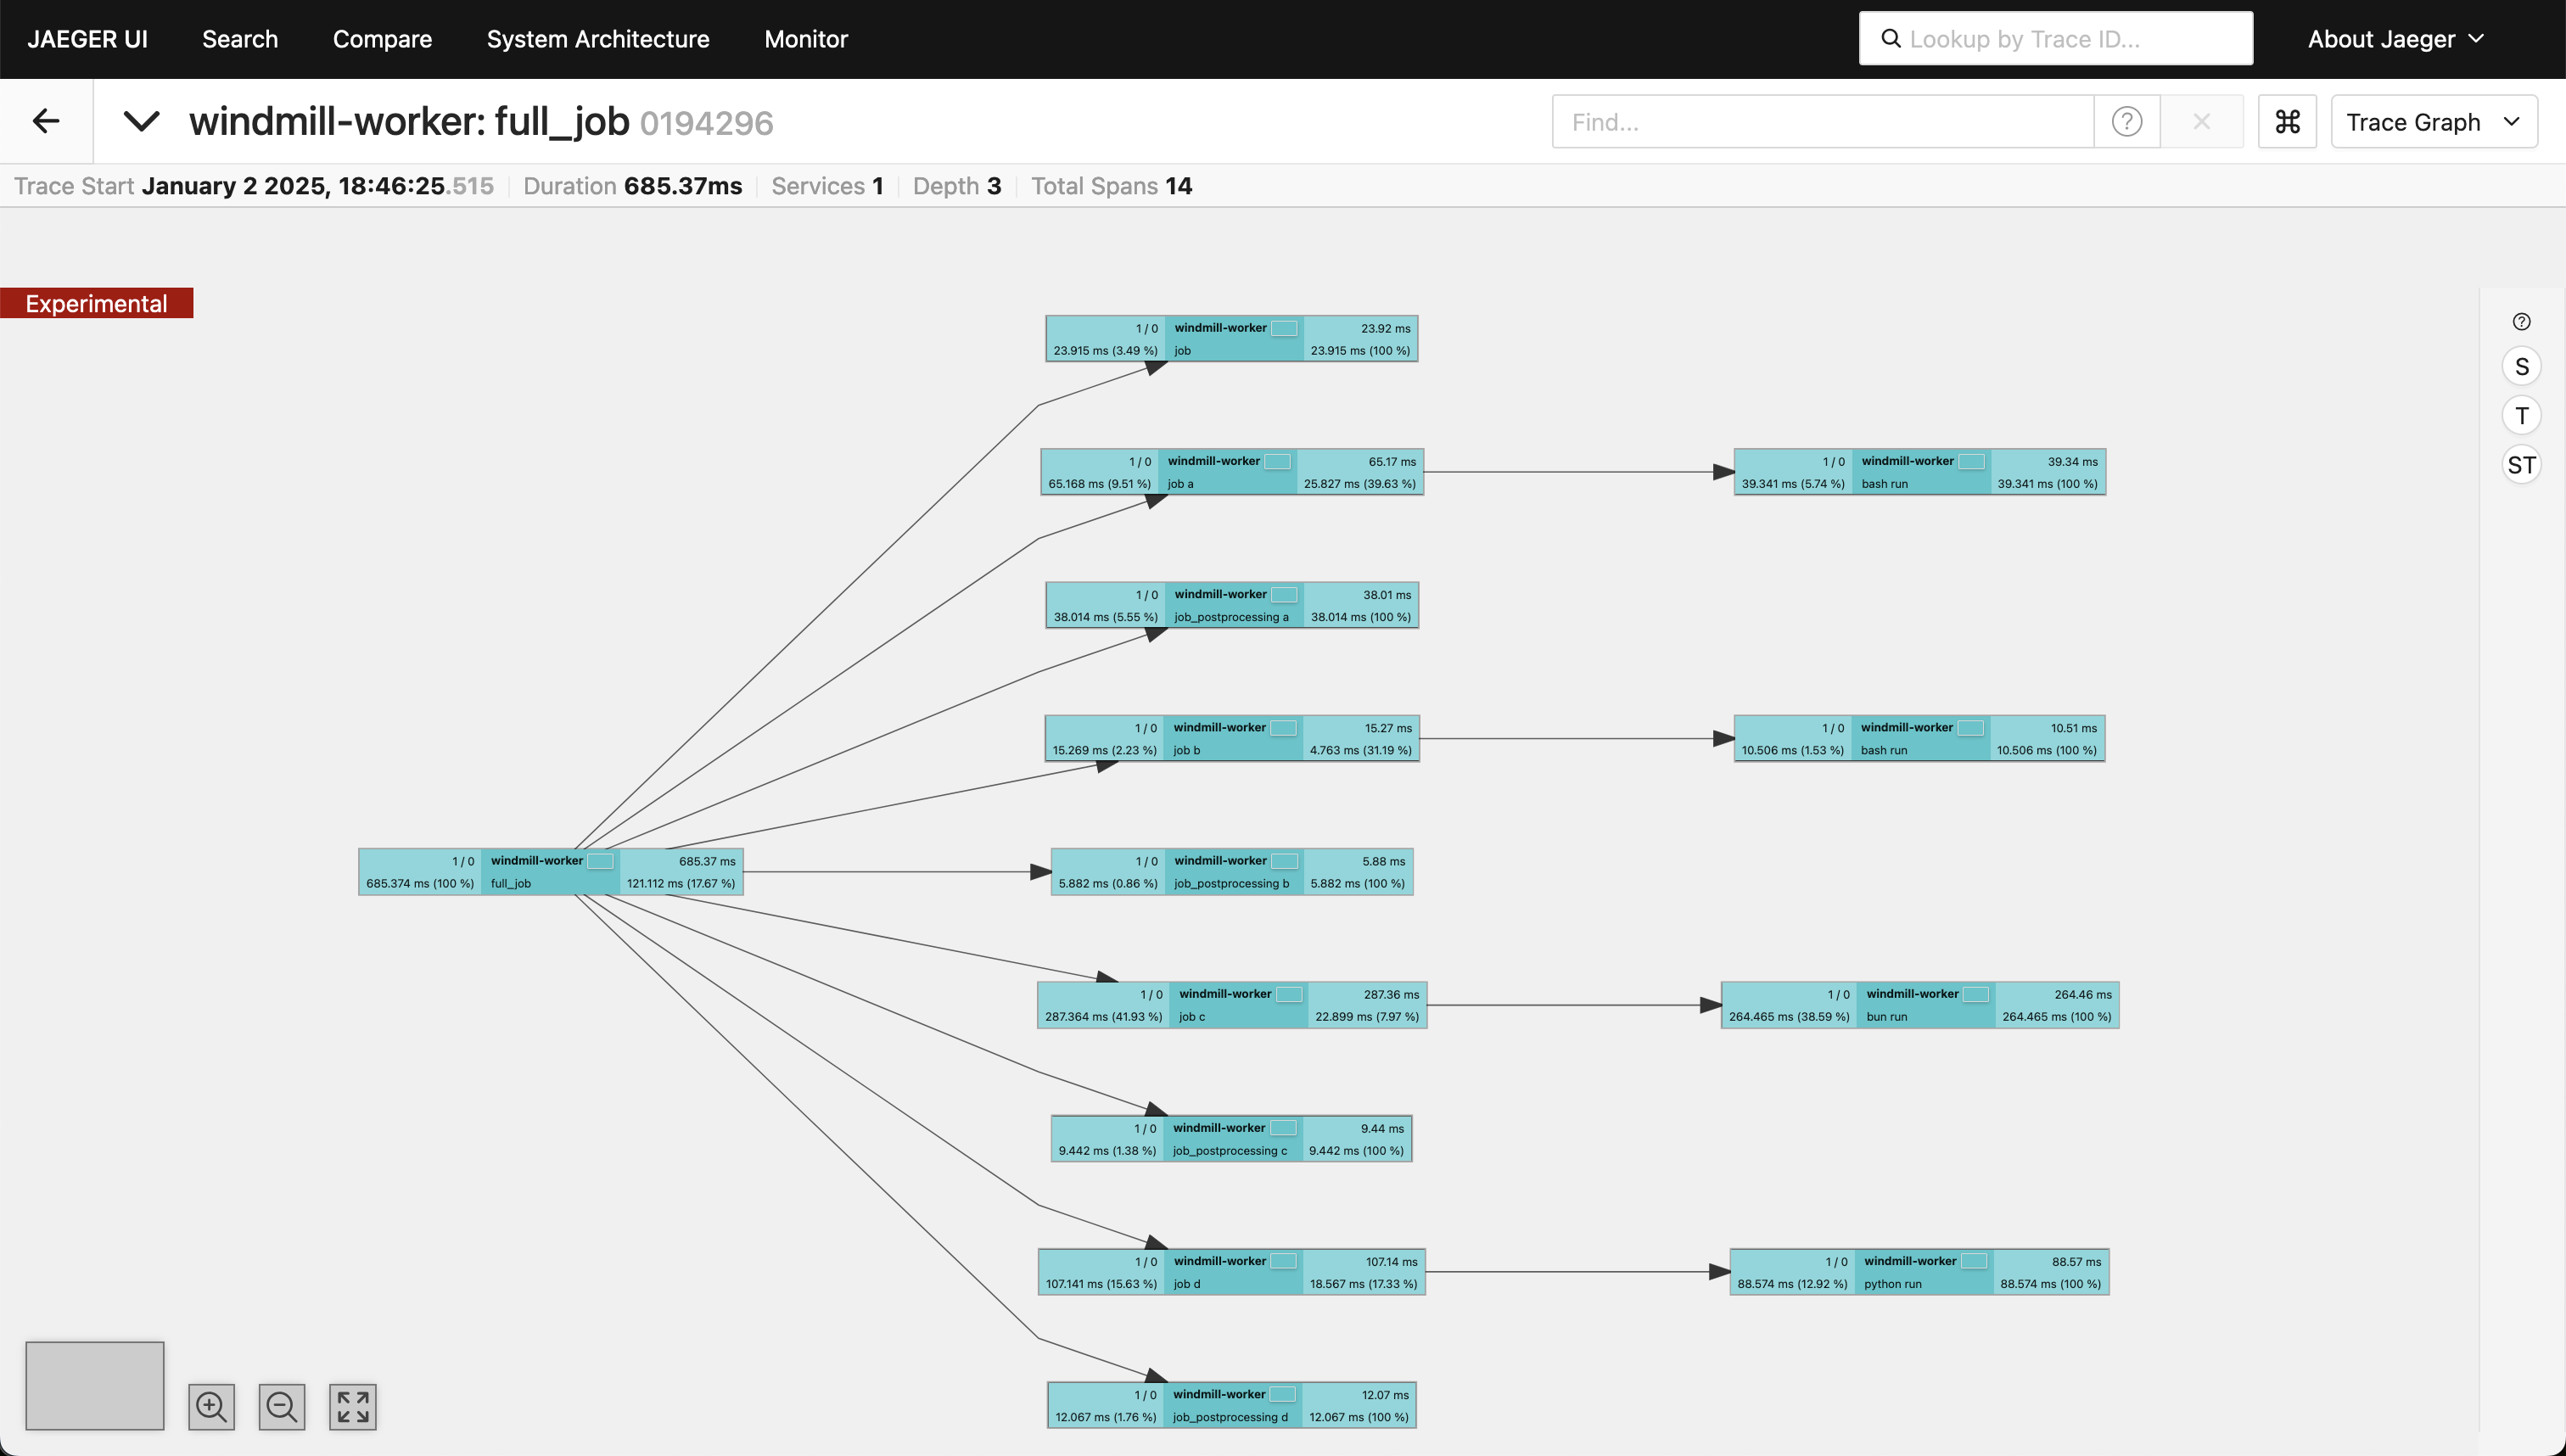
The Jaeger UI if hosted with the docker-compose.yaml file above will be available at http://localhost:16686. When running a script or workflow with Windmill, you will be able to see the traces in the Jaeger UI and investigate them. This can be useful to understand the performance of a workflow and identify bottlenecks in the Windmill server or client.
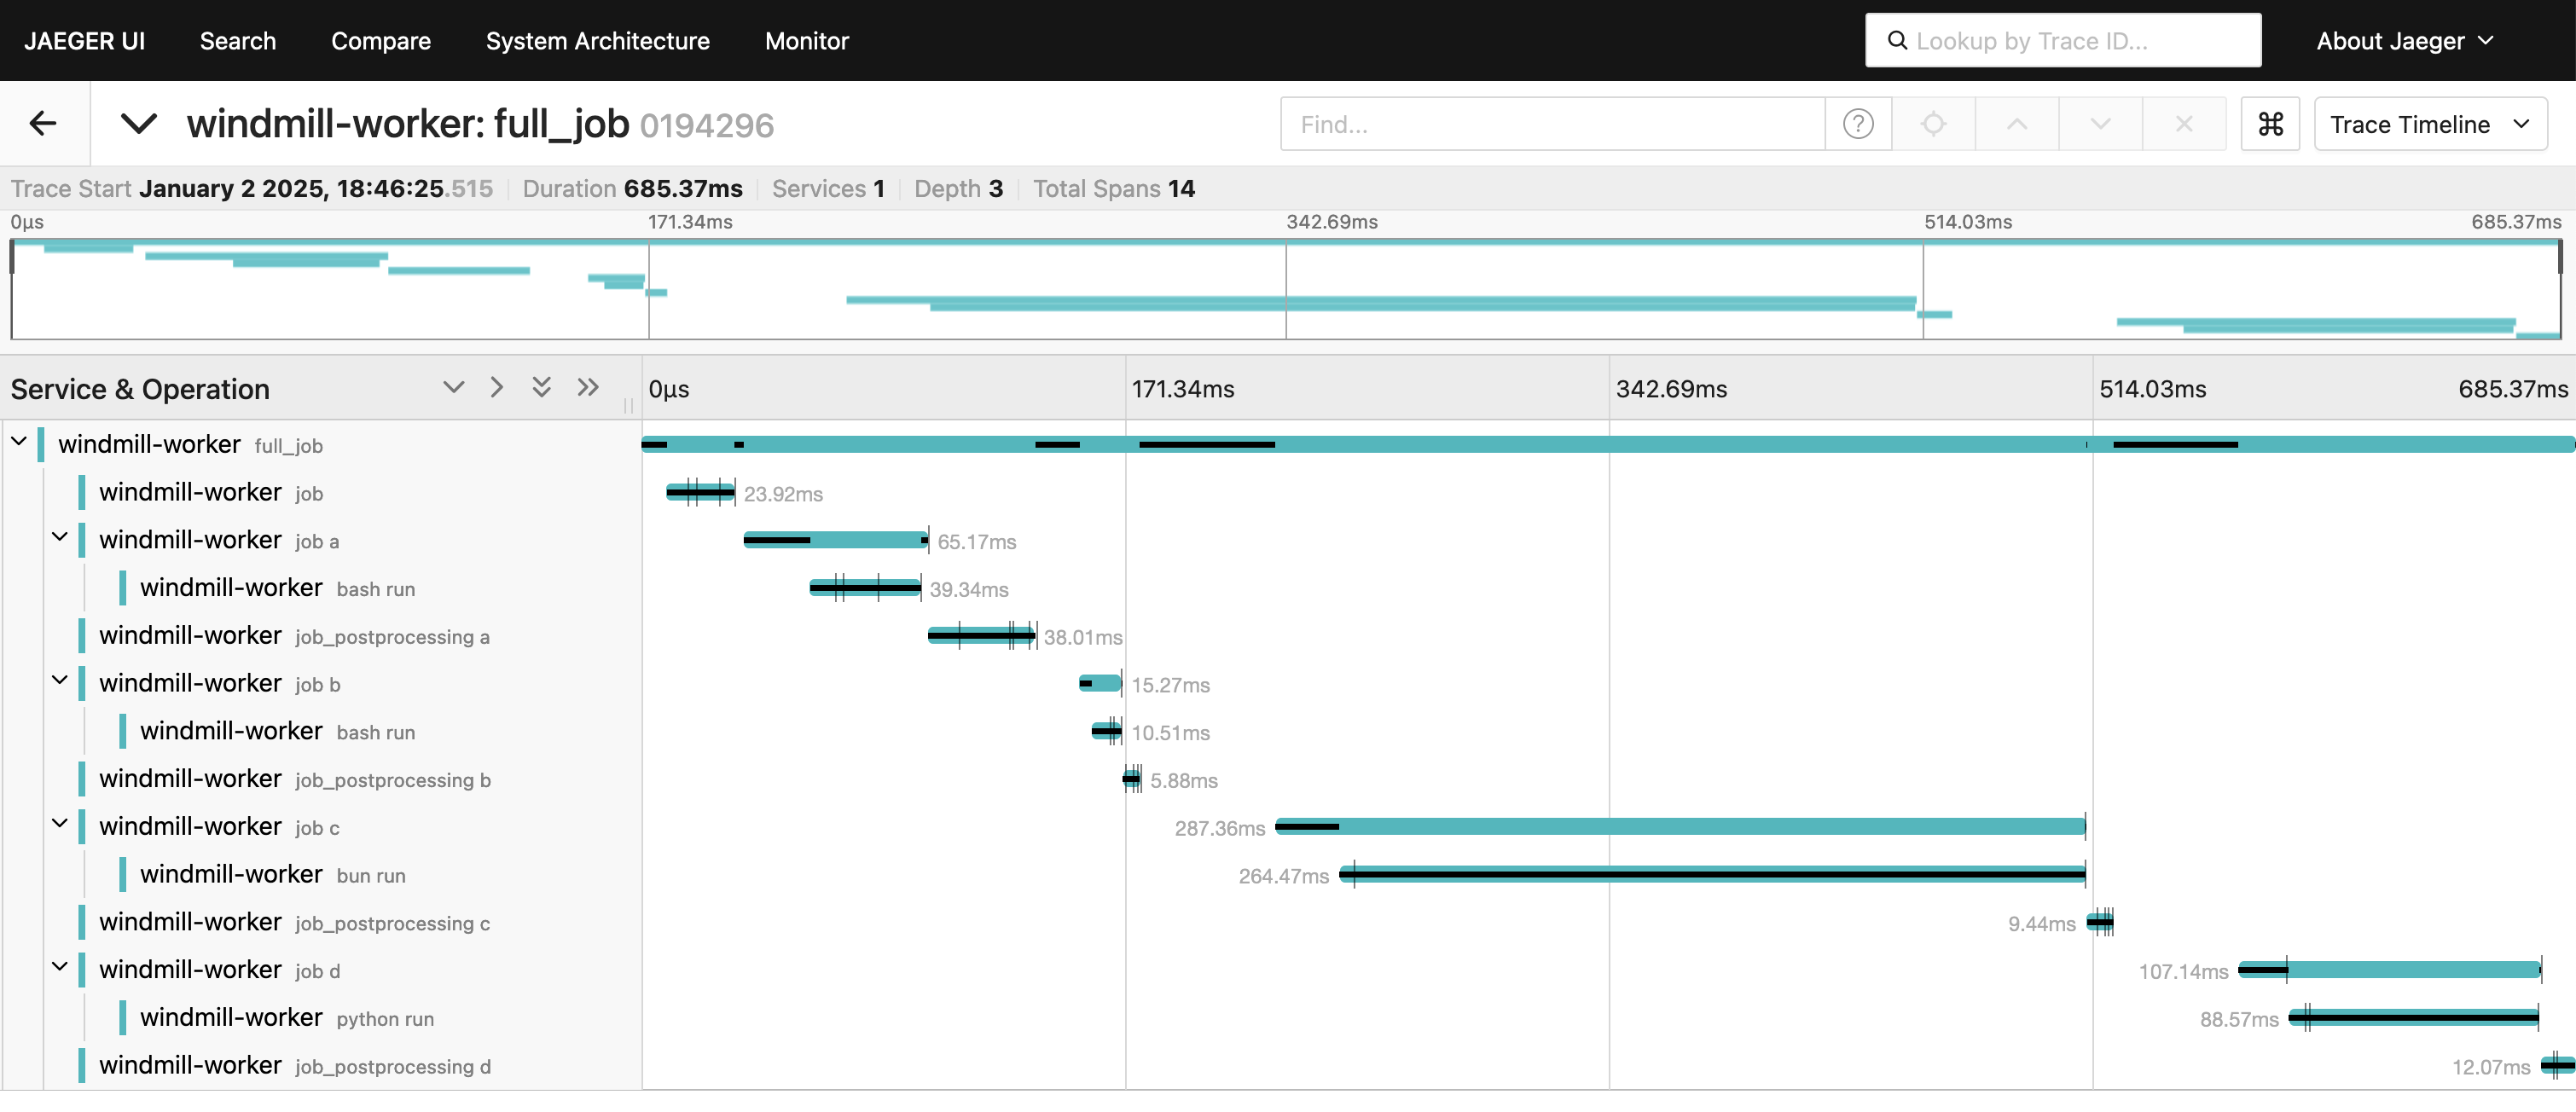
Searching for specific traces
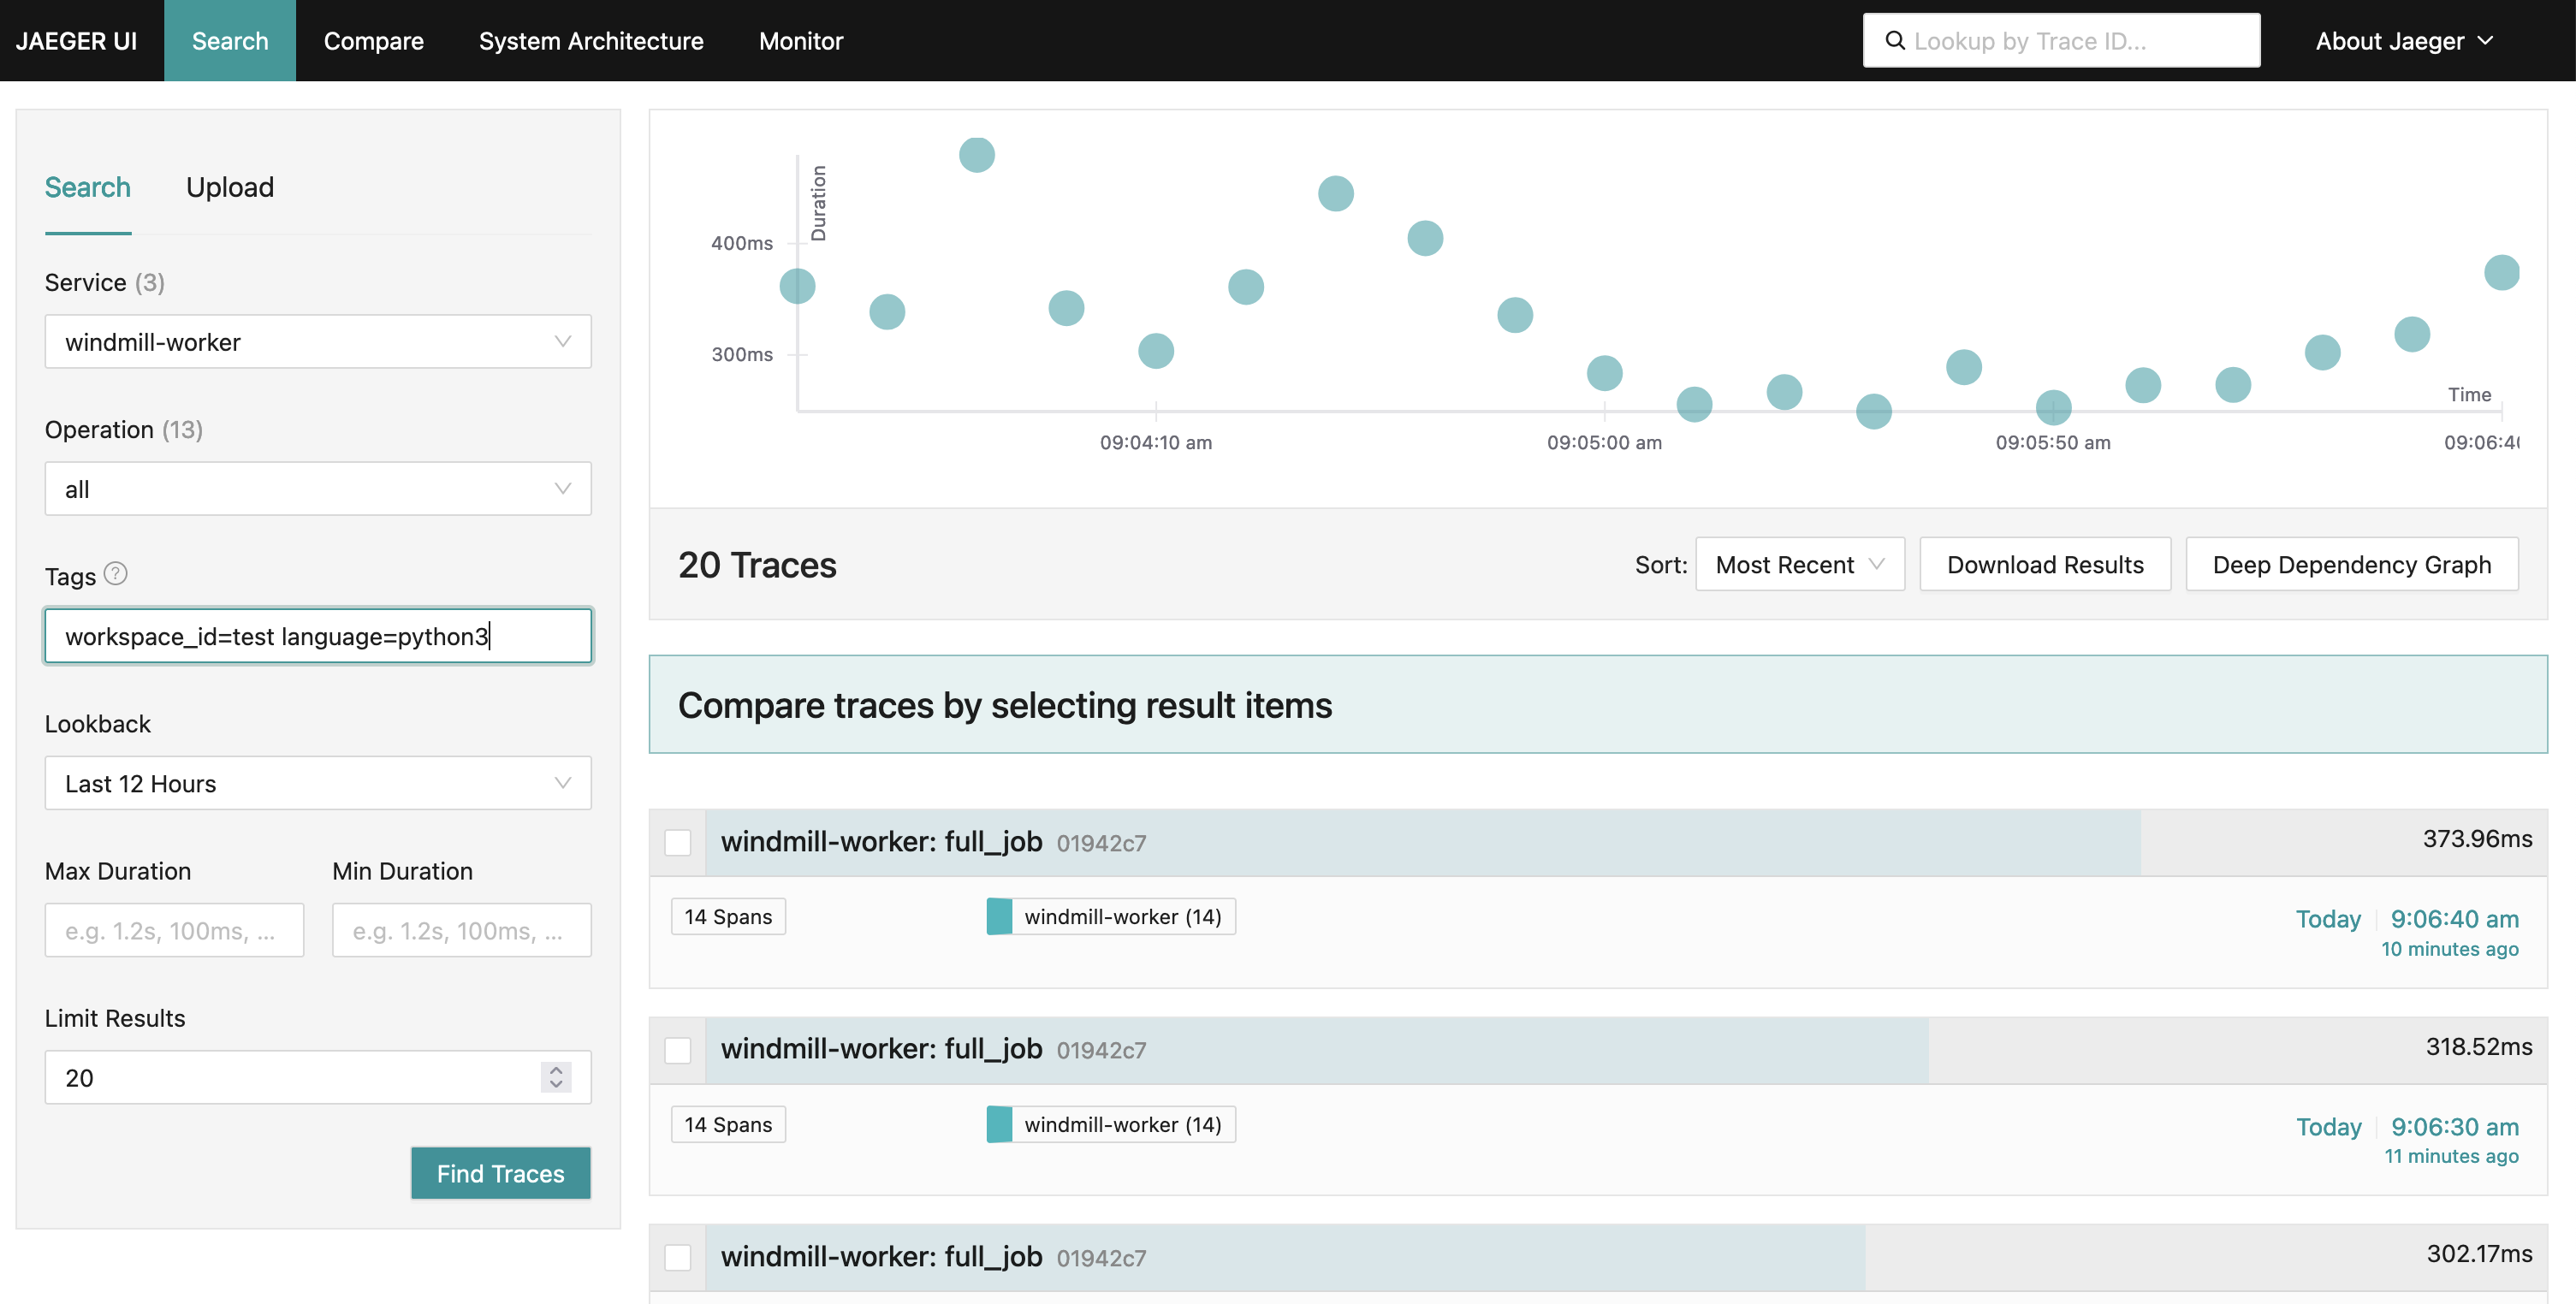
To search/filter for a specific trace, for example a workflow, you can use the search function in the Jaeger UI by filtering by tags set by Windmill.
The following tags are useful to filter for specific traces:
job_id: The ID of the jobroot_job: The ID of the root job (flow)parent_job: The ID of the parent job (flow)flow_step_id: The ID of the step within the workflowscript_path: The path of the scriptworkspace_id: The name of the workspaceworker_id: The ID of the workerlanguage: The language of the scripttag: The queue tag of the workflow
Monitoring metrics with Jaeger
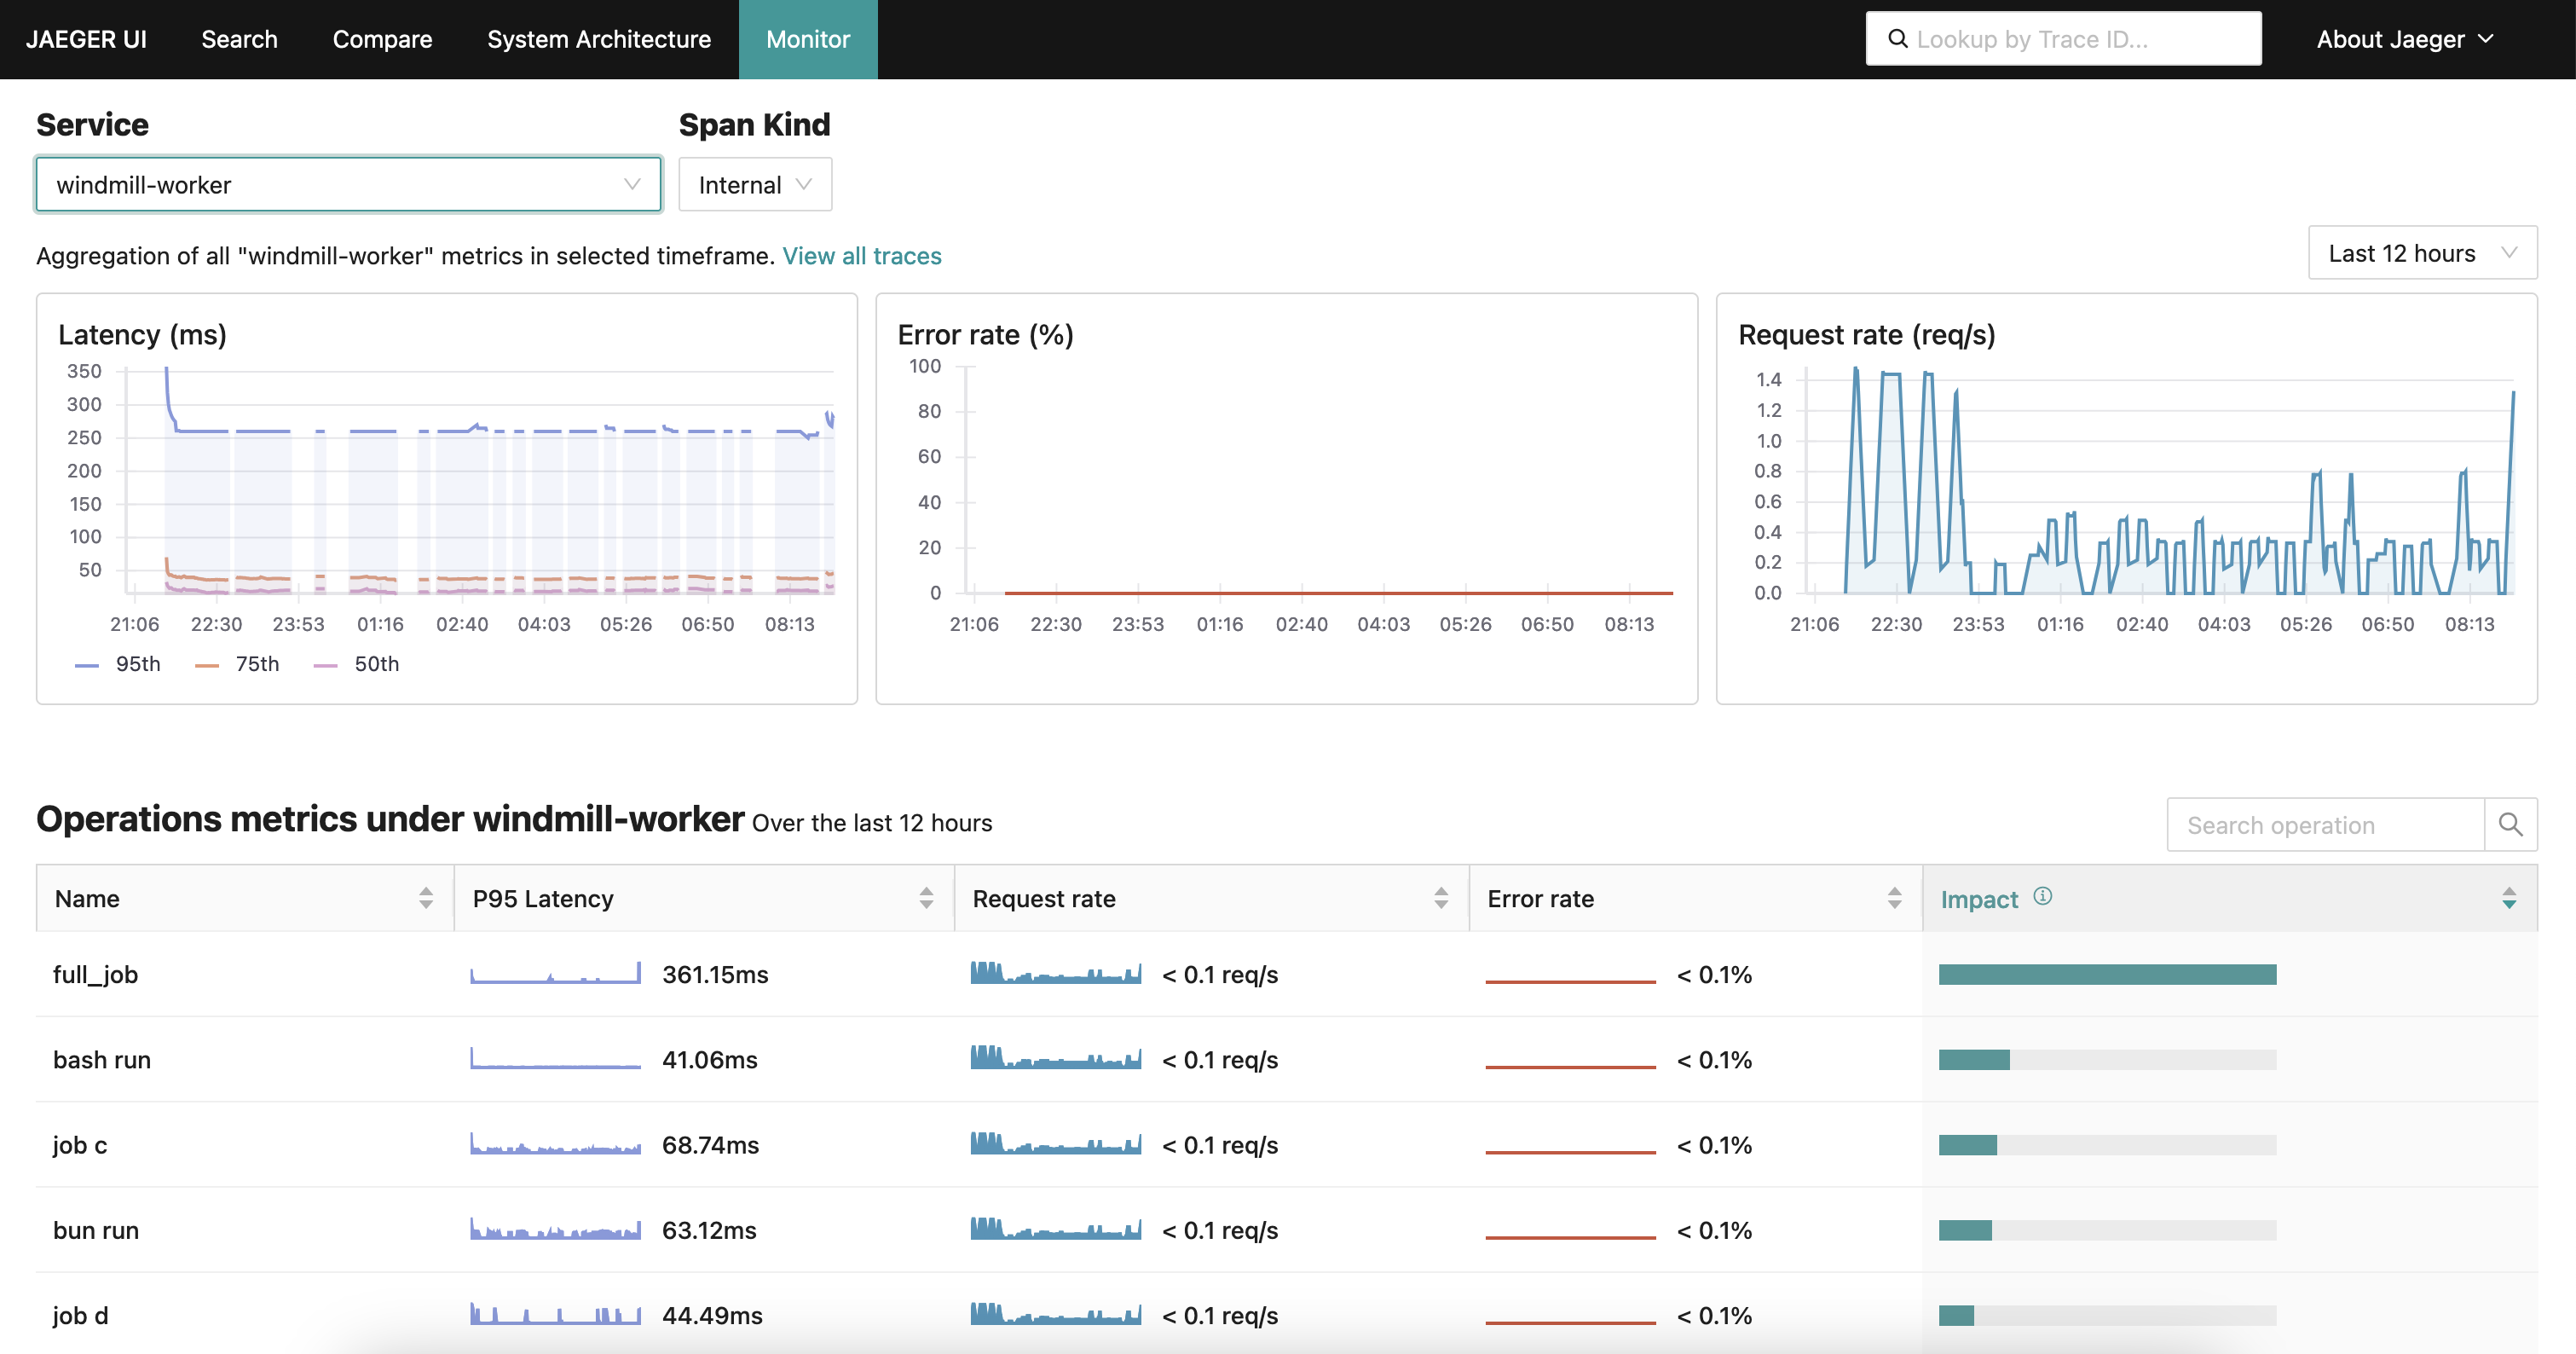
Jaeger can be used to generate time series for metrics of the collected traces. These time series can be used to compare the performance of individual steps within a workflow and their overall performance and realtive contribution over time as well as identify and troubleshoot issues and anomalies.
To set this up, Jaeger needs to store the generated metrics in PromQL-compatible storage such as Prometheus.
If you do don't have an existing Prometheus instance, you can start one with the following in your docker-compose.yml file or uncomment the prometheus service in the docker-compose.yml file in the Windmill repo.
  prometheus:
    image: prom/prometheus:latest
    expose:
      - 9090
    volumes:
      - ./prometheus-config.yaml:/etc/prometheus/prometheus.yml
    command:
      - "--config.file=/etc/prometheus/prometheus.yml"
with the following prometheus-config.yaml file:
global:
  scrape_interval: 15s
  evaluation_interval: 15s

scrape_configs:
  - job_name: aggregated-trace-metrics
    static_configs:
    - targets: ['jaeger:8889']
In order to use prometheus with Jaeger, you need to configure Jaeger to send metrics to Prometheus. For this we will mount a config file to the Jaeger container that will enable the metrics export.
In the docker-compose.yml file, add the following to the Jaeger service:
  jaeger:
    image: jaegertracing/jaeger:latest
    ports:
      - "16686:16686"
    expose:
      - 4317
      - 8889
    volumes:
      - ./jaeger-config.yaml:/etc/jaeger/config.yml
    command: ["--config", "/etc/jaeger/config.yml"]
and the following jaeger-config.yaml file:
service:
  extensions: [jaeger_storage, jaeger_query]
  pipelines:
    traces:
      receivers: [otlp]
      processors: [batch]
      exporters: [jaeger_storage_exporter, spanmetrics]
    metrics/spanmetrics:
      receivers: [spanmetrics]
      exporters: [prometheus]
  telemetry:
    resource:
      service.name: jaeger
    metrics:
      level: detailed
      address: 0.0.0.0:8888
    logs:
      level: DEBUG

extensions:
  jaeger_query:
    storage:
      traces: some_storage
      metrics: some_metrics_storage
  jaeger_storage:
    backends:
      some_storage:
        memory:
          max_traces: 100000
    metric_backends:
      some_metrics_storage:
        prometheus:
          endpoint: http://prometheus:9090
          normalize_calls: true
          normalize_duration: true

connectors:
  spanmetrics:

receivers:
  otlp:
    protocols:
      grpc:
        endpoint: "0.0.0.0:4317"

processors:
  batch:

exporters:
  jaeger_storage_exporter:
    trace_storage: some_storage
  prometheus:
    endpoint: "0.0.0.0:8889"
In the Jaeger UI, you will now be able to see metrics time series for the traces in the "Monitor" tab.
Tracing with Tempo and Grafana
Tempo is a distributed tracing system that is part of the Grafana stack. It is designed to collect, store, and query traces from distributed systems. Tempo is a scalable and efficient solution for tracing, providing a comprehensive view of the performance and behavior of your applications and infrastructure.
Setting up an OpenTelemetry collector and Tempo
Use the docker-compose.yml file in the Windmill repo as a starting point. Compared to the Jaeger setup, this setup also includes a Loki instance to store the logs as well as a dedicated OpenTelemetry collector that will be used to collect traces from the Windmill instance and distribute them to Tempo and Loki.
It you already have a Tempo instance and/or Loki instance, make sure to update the OpenTelemetry collector configuration to point to your existing Loki and Tempo instances.
OpenTelemetry collector configuration:
receivers:
  otlp:
    protocols:
      grpc:
        endpoint: 0.0.0.0:4317

processors:
  batch:
    timeout: 5s

exporters:
  otlphttp/loki:
    endpoint: http://loki:3100/otlp
    tls:
      insecure: true
  otlp/tempo:
    endpoint: http://tempo:4317
    tls:
      insecure: true

service:
  pipelines:
    traces:
      receivers: [otlp]
      processors: [batch]
      exporters: [otlp/tempo]
    logs:
      receivers: [otlp]
      processors: [batch]
      exporters: [otlphttp/loki]
In the Tempo configuration we'll enable the metrics pipeline and set the metrics storage to point to the Prometheus instance. As with Jaeger, this will allow us to query metrics in Grafana.
Tempo configuration:
stream_over_http_enabled: true
server:
  http_listen_port: 3200
  log_level: info

query_frontend:
  search:
    duration_slo: 5s
    throughput_bytes_slo: 1.073741824e+09
    metadata_slo:
        duration_slo: 5s
        throughput_bytes_slo: 1.073741824e+09
  trace_by_id:
    duration_slo: 5s

distributor:
  receivers:
    otlp:
      protocols:
        grpc:
          endpoint: "tempo:4317"

ingester:
  max_block_duration: 5m

compactor:
  compaction:
    block_retention: 1h

metrics_generator:
  registry:
    external_labels:
      source: tempo
      cluster: windmill
  storage:
    path: /var/tempo/generator/wal
    remote_write:
      - url: http://prometheus:9090/api/v1/write
        send_exemplars: true
  traces_storage:
    path: /var/tempo/generator/traces

storage:
  trace:
    backend: local
    wal:
      path: /var/tempo/wal
    local:
      path: /var/tempo/blocks

overrides:
  defaults:
    metrics_generator:
      processors: [service-graphs, span-metrics, local-blocks]
      generate_native_histograms: both
Setting up Loki
Loki is a log storage system that is part of the Grafana stack. It is designed to store and query logs from distributed systems. Loki is a scalable and efficient solution for logging, providing a comprehensive view of the performance and behavior of your applications and infrastructure.
Learn more about Loki and how to configure it here. For Windmill, we'll use the in-memory storage backend and set the HTTP listen port to 3100 but you can configure it to use a persistent storage backend and change the port and other settings as needed.
Loki configuration:
auth_enabled: false

server:
  http_listen_port: 3100

common:
  ring:
    instance_addr: 0.0.0.0
    kvstore:
      store: inmemory
  replication_factor: 1
  path_prefix: /tmp/loki

schema_config:
  configs:
  - from: 2020-05-15
    store: tsdb
    object_store: filesystem
    schema: v13
    index:
      prefix: index_
      period: 24h

storage_config:
  filesystem:
    directory: /tmp/loki/chunks

limits_config:
  allow_structured_metadata: true
Setting up Prometheus
Prometheus is a monitoring and observability platform that is part of the Grafana stack. In this context it is designed to store and query metrics generated by Tempo.
Learn more about Prometheus and how to configure it here.
Prometheus configuration:
global:
  scrape_interval:     15s
  evaluation_interval: 15s

scrape_configs:
  - job_name: 'prometheus'
    static_configs:
      - targets: [ 'localhost:9090' ]
  - job_name: 'tempo'
    static_configs:
      - targets: [ 'tempo:3200' ]
Setting up Grafana
Grafana is a monitoring and observability platform that is part of the Grafana stack. It is designed to visualize and query metrics, traces and logs from distributed systems.
Learn more about Grafana and how to configure it here. For Windmill, we'll use the Tempo datasource for traces and Loki as a log datasource. Furthermore, metrics can be visualized in Grafana by using the Prometheus datasource and the metrics generated by Tempo.
Configure Windmill to use Tempo and Loki
In the Windmill UI, go to the "Instances Settings" and "OTEL/Prom" tab and fill in the OpenTelemetry collector endpoint http://otel-collector:4317 and toggle both the Tracing and Logs options.
Open the Grafana UI
The Grafana UI if hosted with the docker-compose.yaml file above will be available at http://localhost:3000.
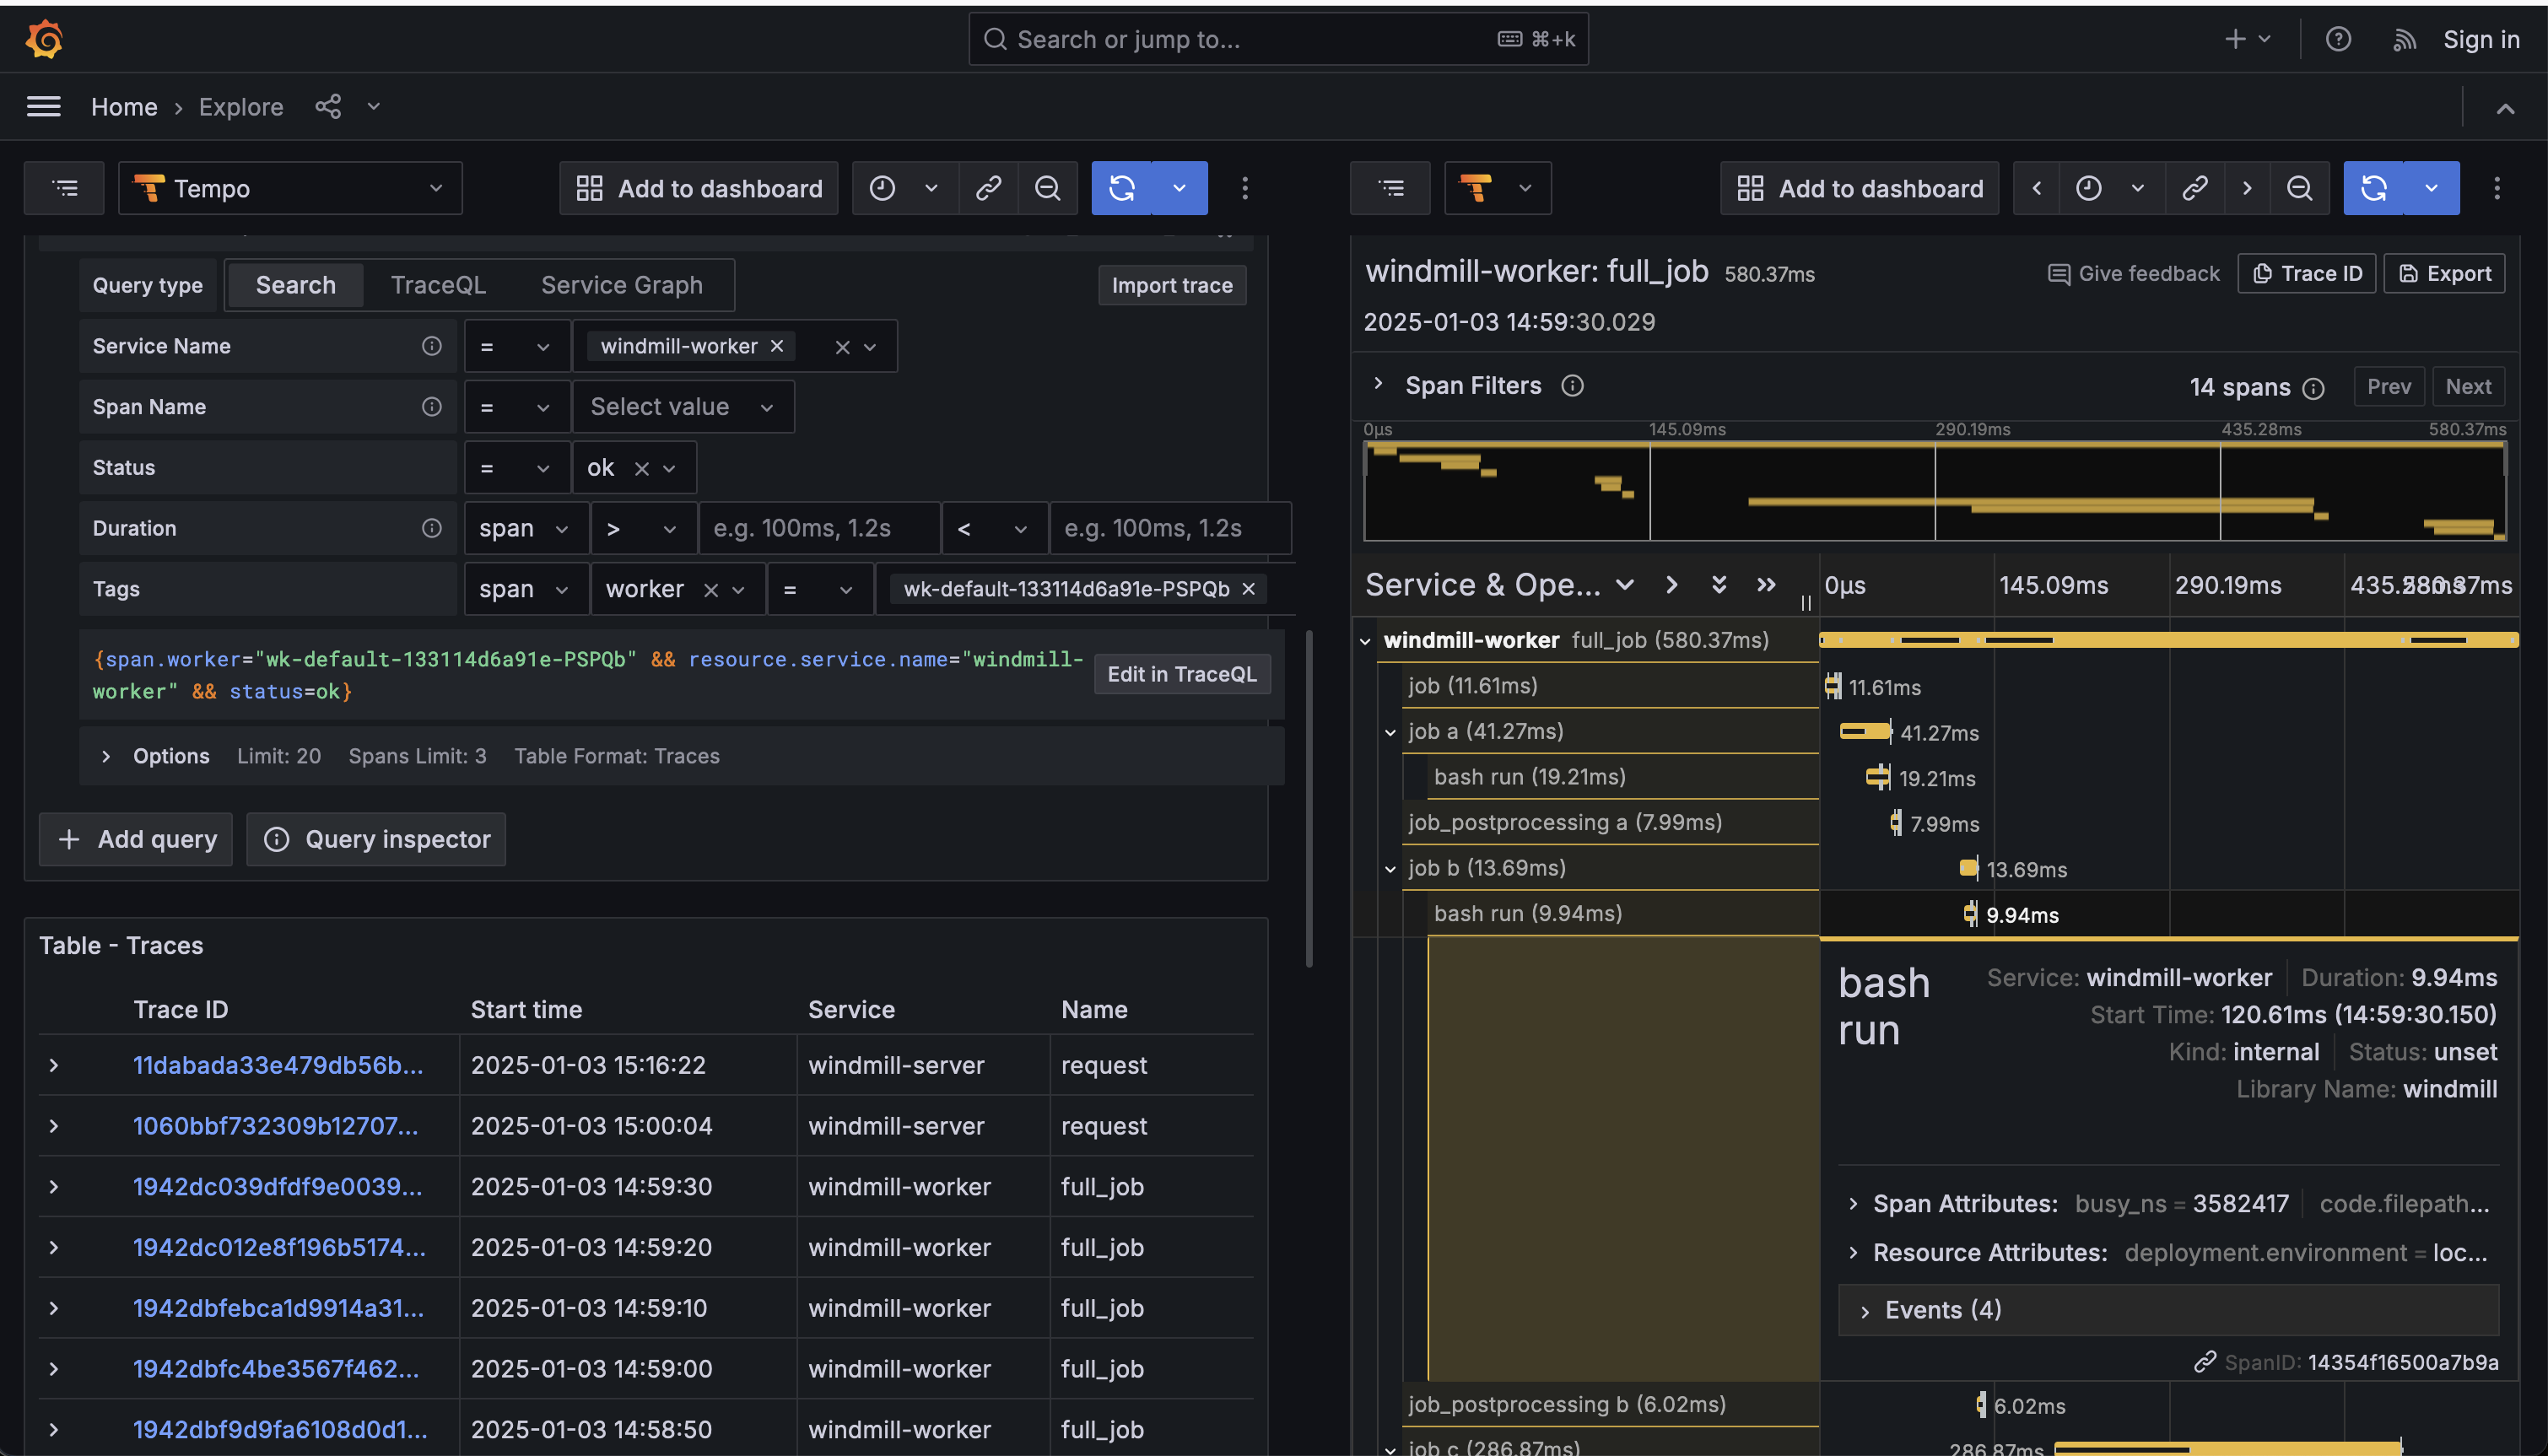
Traces
As with Jaeger, you can search for specific traces by filtering by tags set by Windmill.
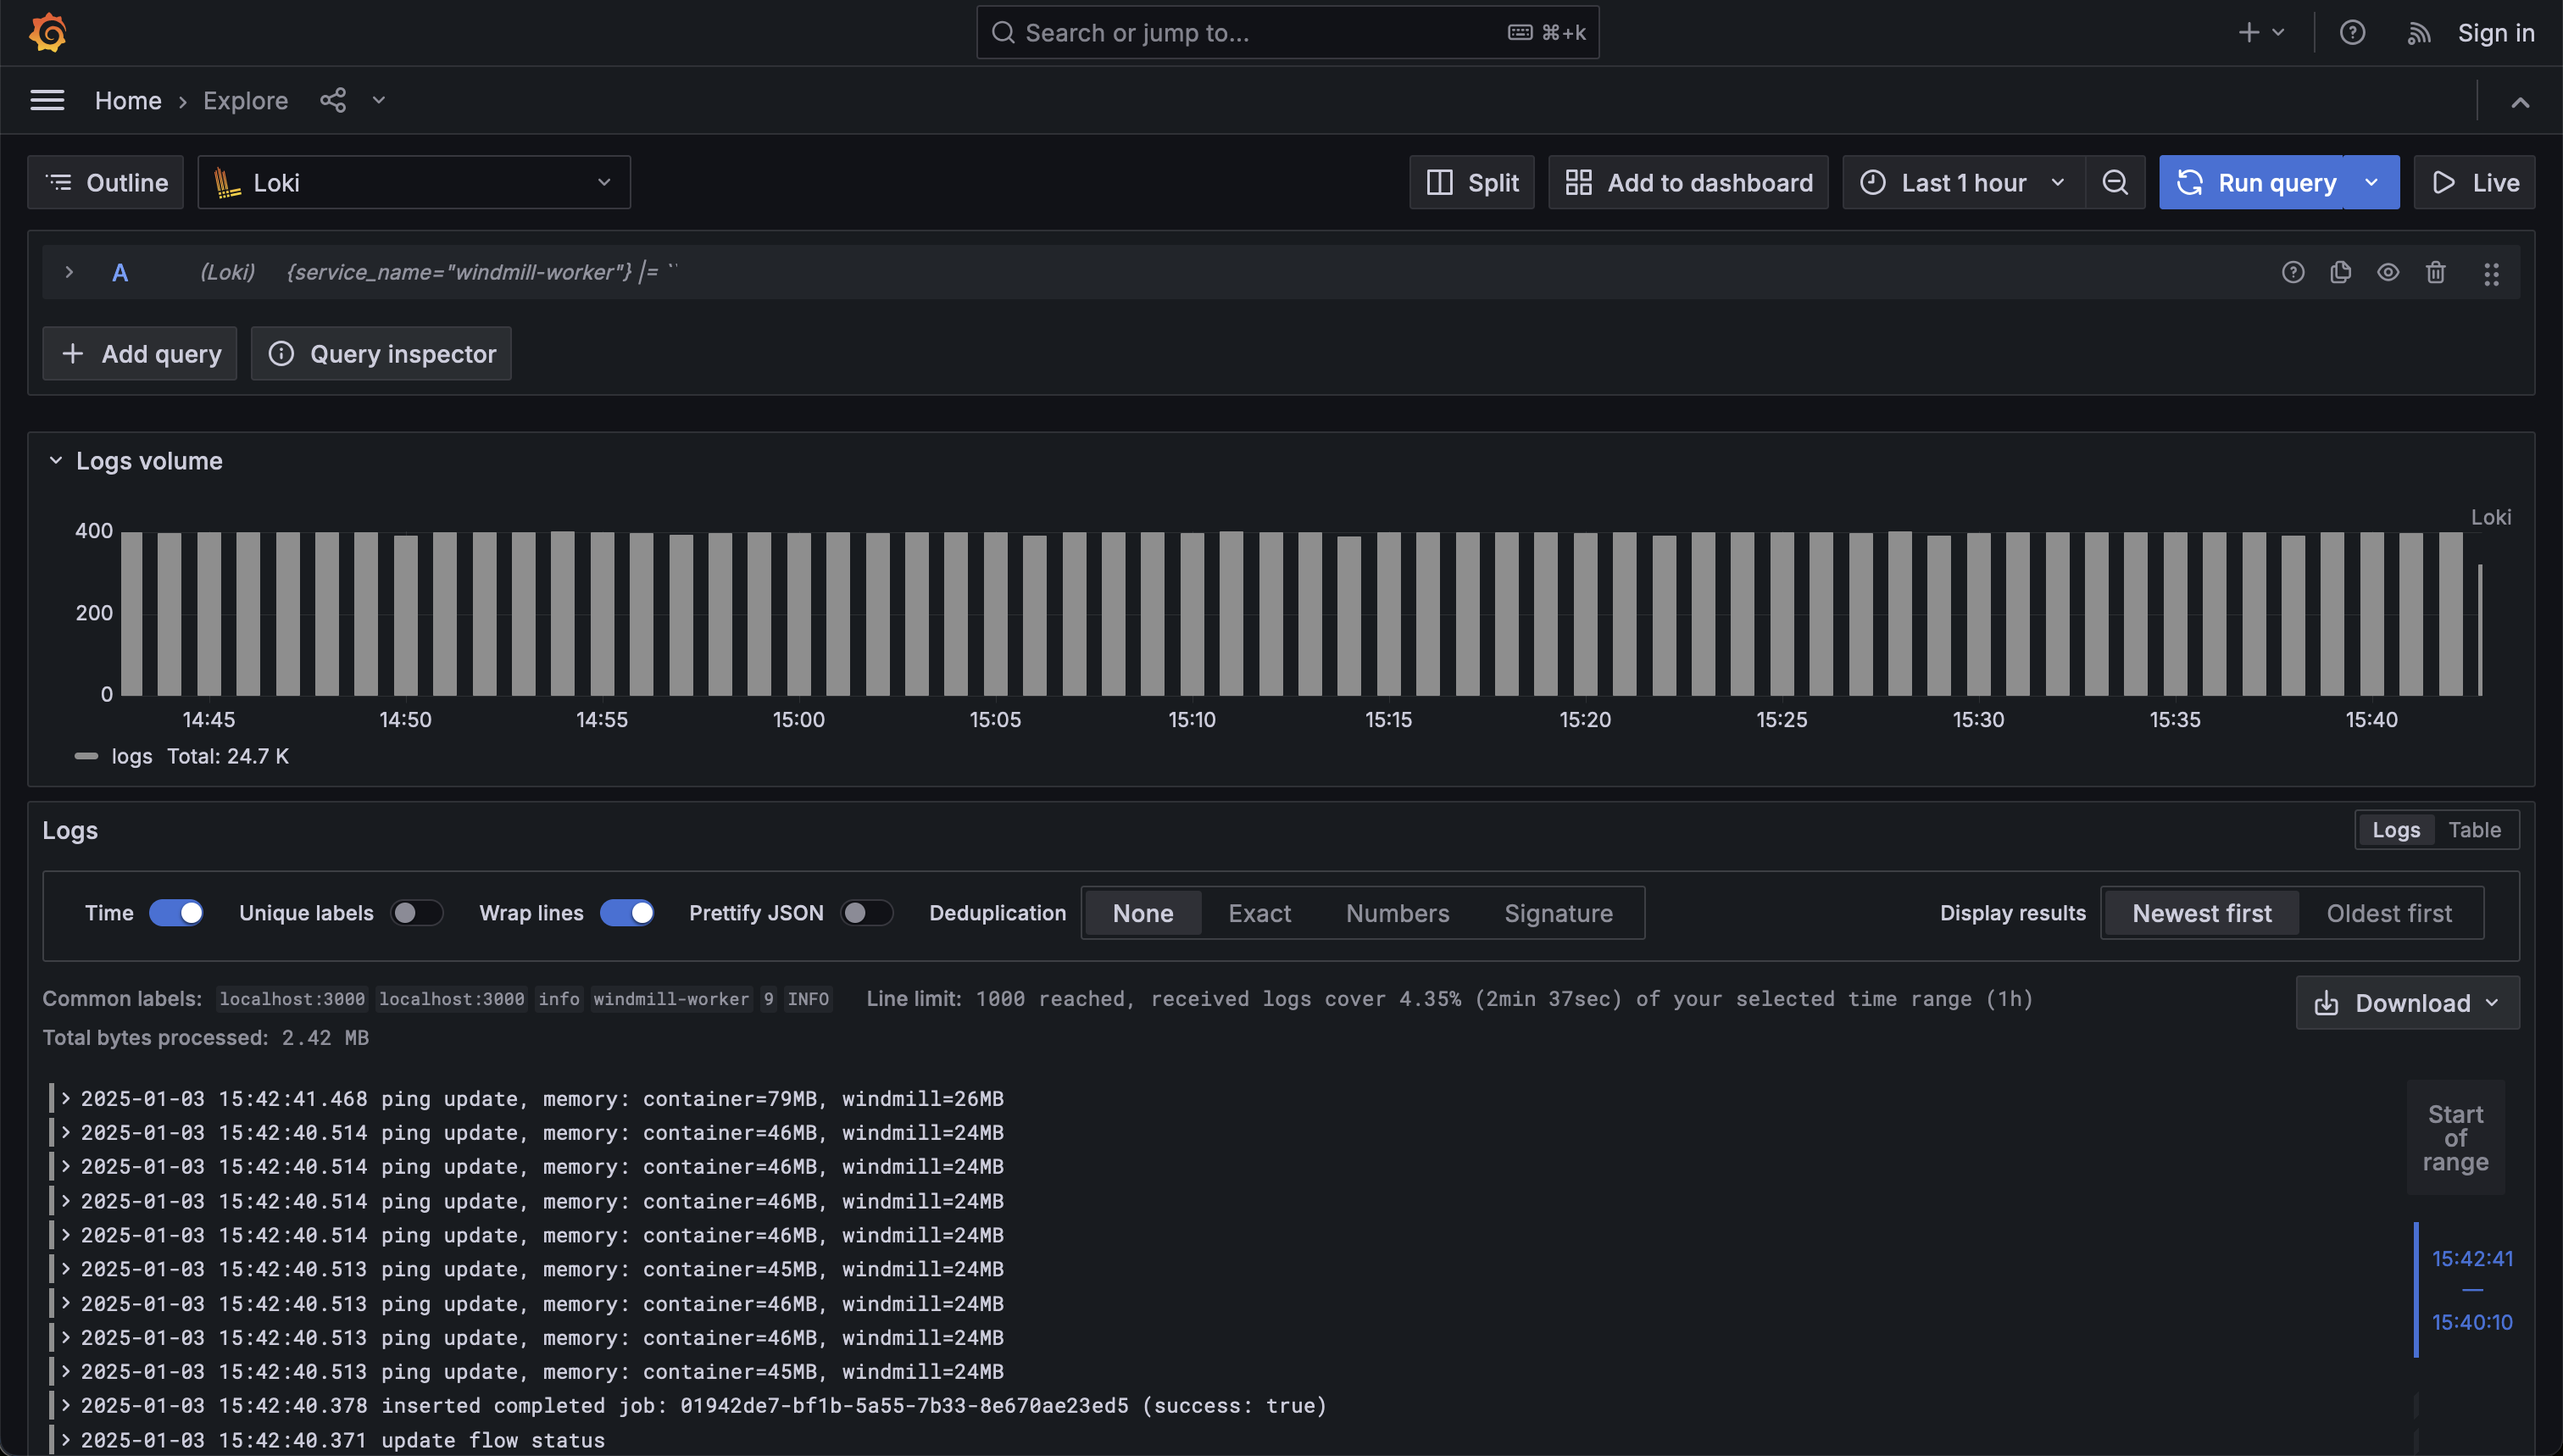
Logs
For logs, select the Loki datasource and you will be able to see the logs in the Loki UI.
Metrics
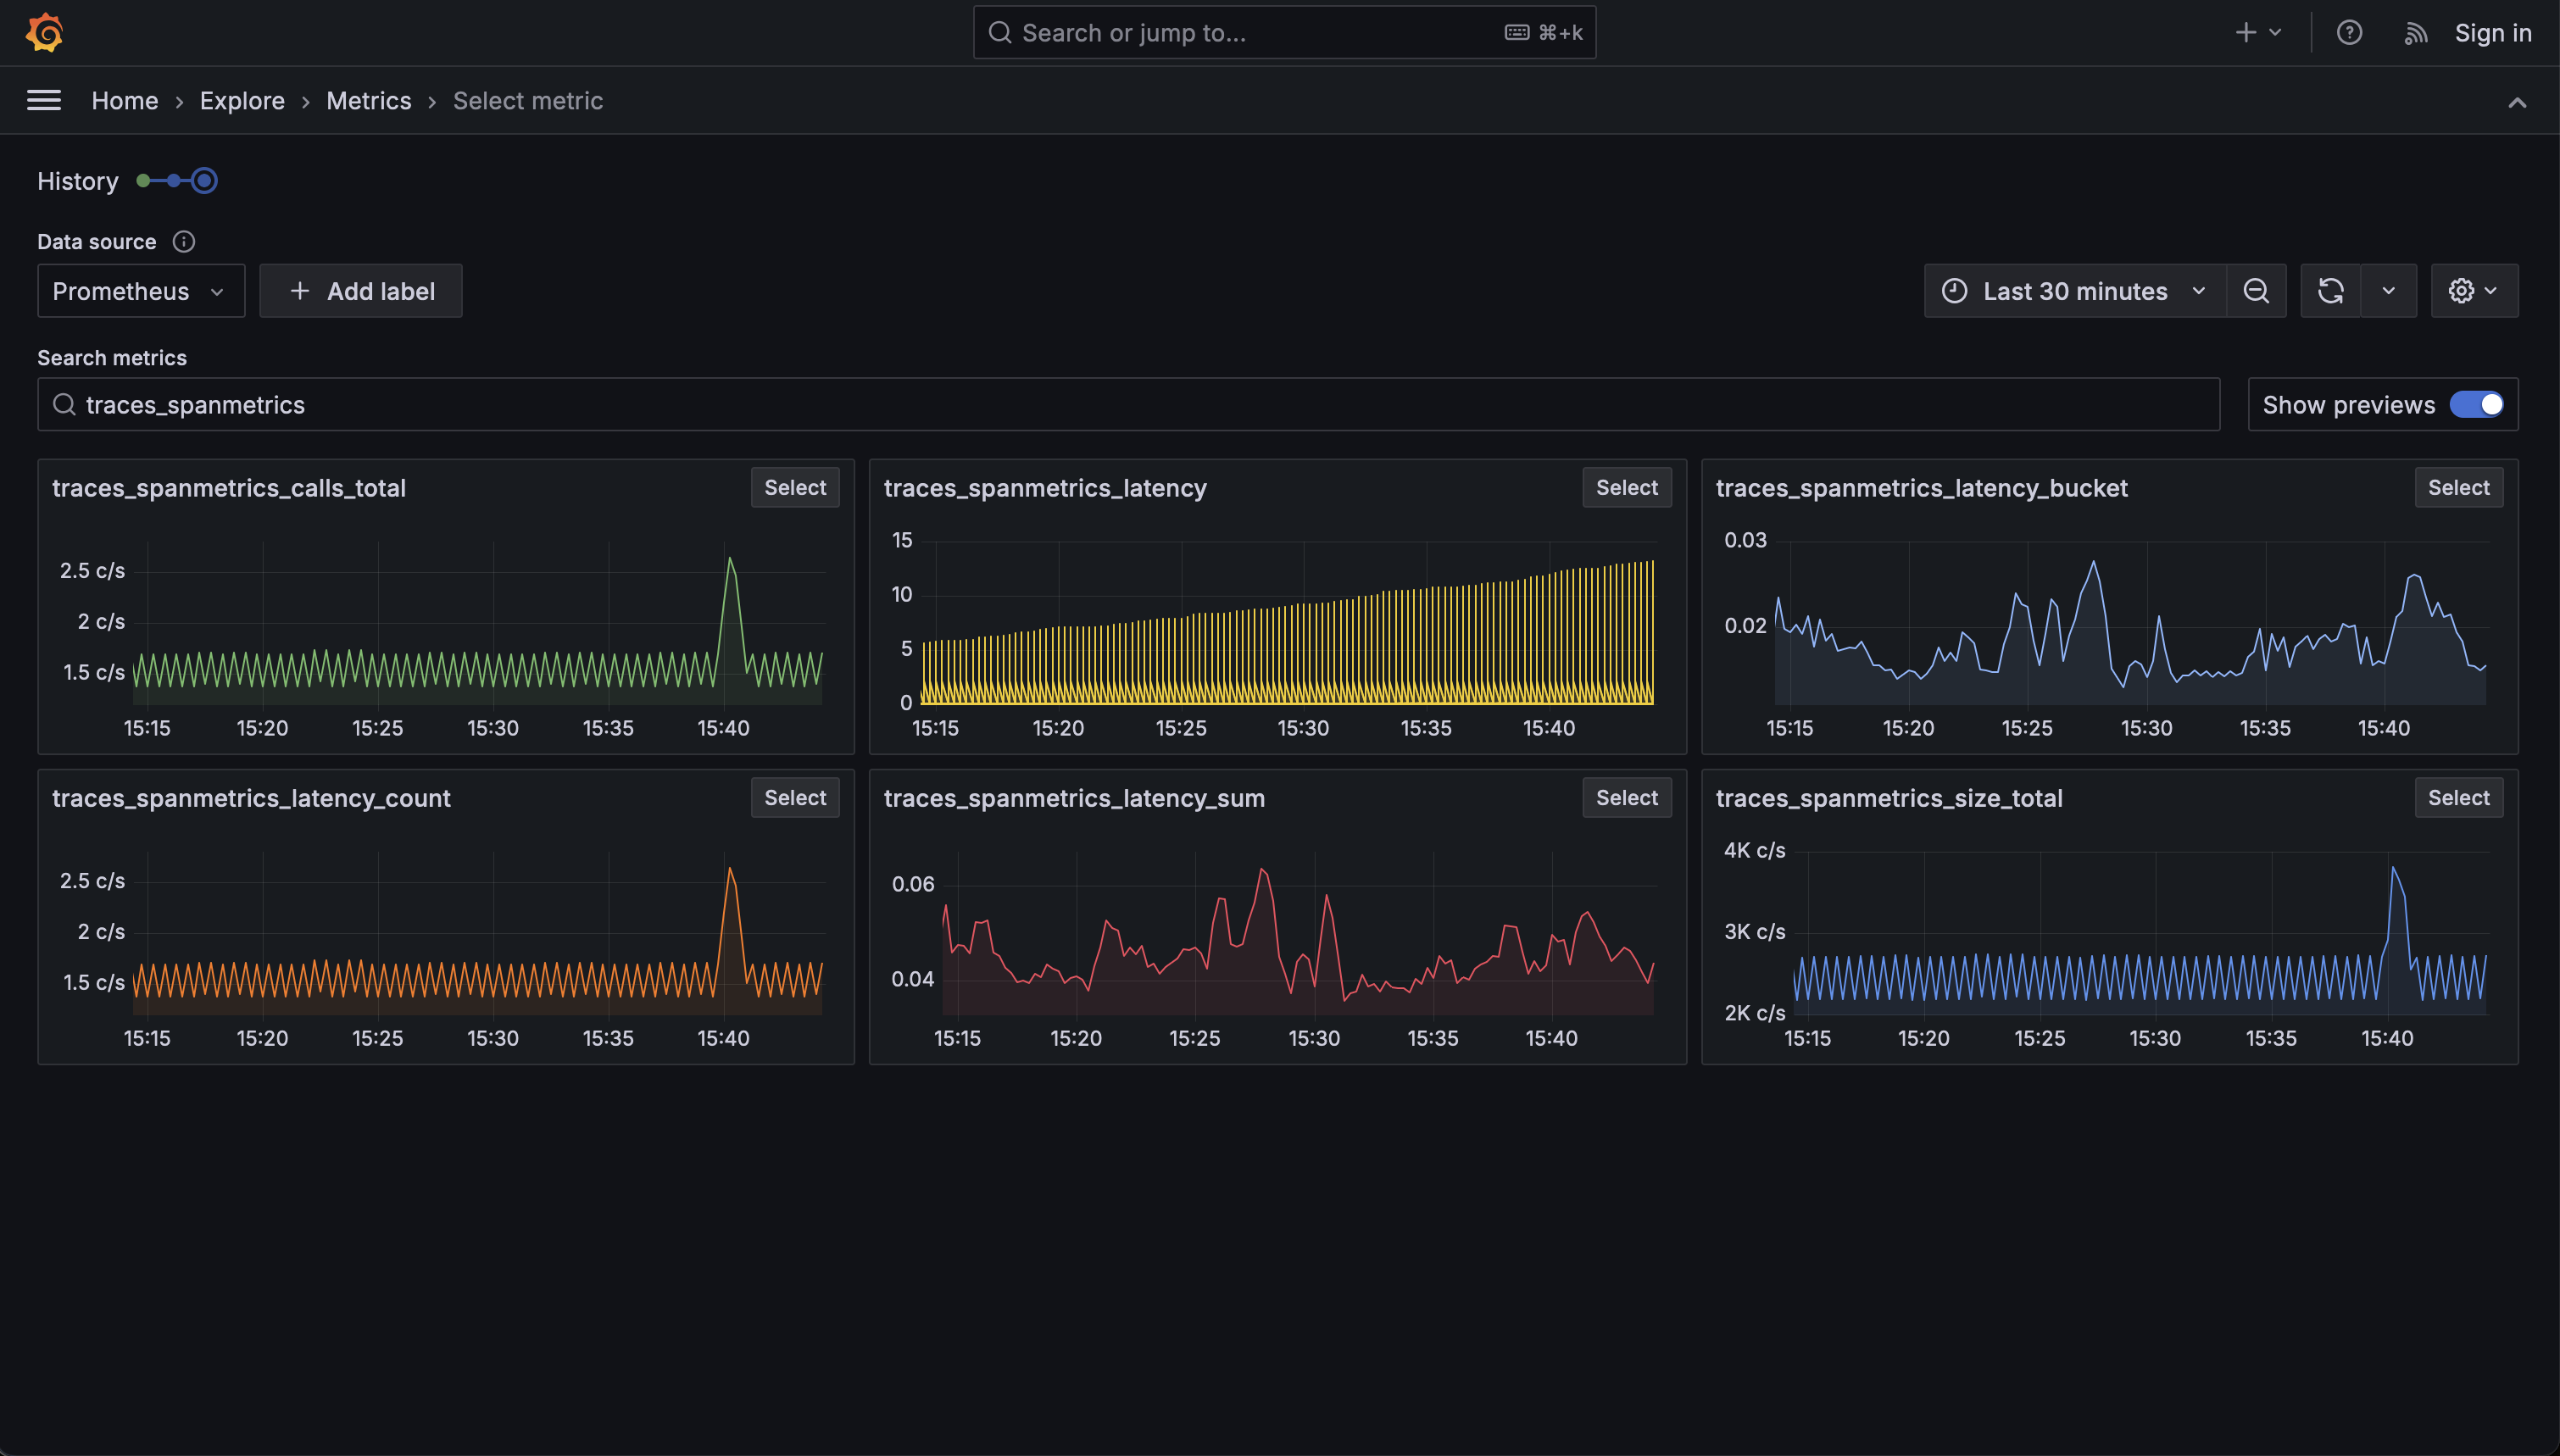
For metrics, select the Prometheus datasource and you will be able to see the metrics in the Prometheus UI.
The metrics generated by Tempo are labeled as:
- traces_spanmetrics_calls_total
- traces_spanmetrics_latency
- traces_spanmetrics_latency_bucket
- traces_spanmetrics_latency_count
- traces_spanmetrics_latency_sum
- traces_spanmetrics_size_total